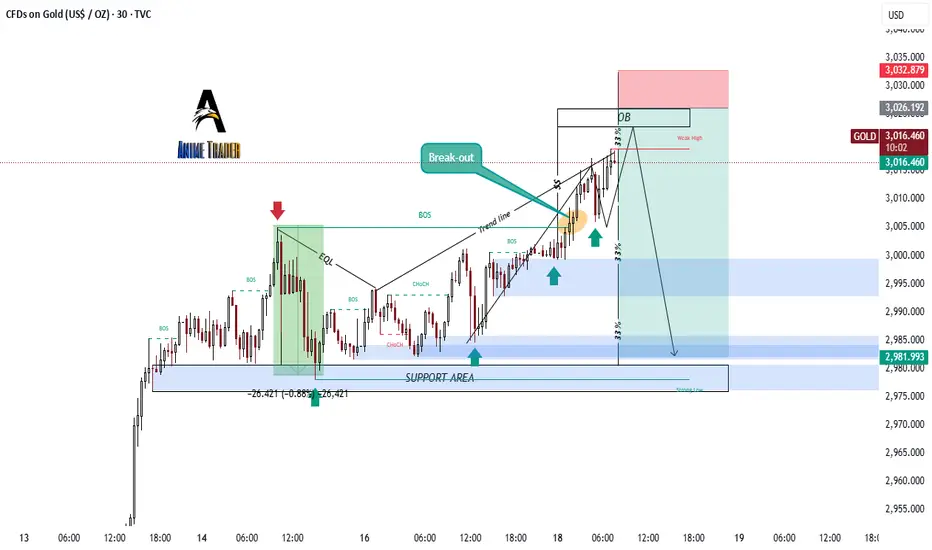
This chart is a technical analysis of Gold (XAU/USD) on a 30-minute timeframe. Here are the key elements visible:
1. *Support and Resistance Levels*
- A *support area* is marked at the bottom, indicating a price zone where buying interest is expected.
- The *weak high* and *order block (OB)* are identified at the top, suggesting a potential resistance area.
2. *Market Structure*
- *BOS (Break of Structure)* points indicate shifts in market momentum.
- *EQL (Equal Lows)* suggests liquidity zones where stop-loss orders might be resting.
- *Trendline* shows the market's upward movement before a possible reversal.
3. *Breakout and Rejection*
- The *breakout* label indicates a strong price movement above previous resistance.
- The *DB (Double Top or Distribution Block)* suggests a potential price reversal.
4. *Potential Trade Setup*
- The price is expected to drop from the *order block* area down toward the *support area*, indicated by the blue downward projection.
- The *red zone (stop-loss area)* and *blue zone (target area)* suggest a short-selling opportunity.
### Conclusion:
This chart suggests a bearish outlook after a strong bullish trend, expecting a price rejection from the *OB zone* and a drop toward lower support levels. Traders might look for sell entries near resistance with targets around the blue demand zone.
t.me/Xauusdanalysischartexperts
I deliver high-quality of forex signals and expert premium analysis updates, backed by meticulous analysis tools. and a commitment to exceptional results.
t.me/Xauusdanalysischartexperts
I deliver high-quality of forex signals and expert premium analysis updates, backed by meticulous analysis tools. and a commitment to exceptional results.
t.me/Xauusdanalysischartexperts
Disclaimer
The information and publications are not meant to be, and do not constitute, financial, investment, trading, or other types of advice or recommendations supplied or endorsed by TradingView. Read more in the Terms of Use.
t.me/Xauusdanalysischartexperts
I deliver high-quality of forex signals and expert premium analysis updates, backed by meticulous analysis tools. and a commitment to exceptional results.
t.me/Xauusdanalysischartexperts
I deliver high-quality of forex signals and expert premium analysis updates, backed by meticulous analysis tools. and a commitment to exceptional results.
t.me/Xauusdanalysischartexperts
Disclaimer
The information and publications are not meant to be, and do not constitute, financial, investment, trading, or other types of advice or recommendations supplied or endorsed by TradingView. Read more in the Terms of Use.