Price Levels:
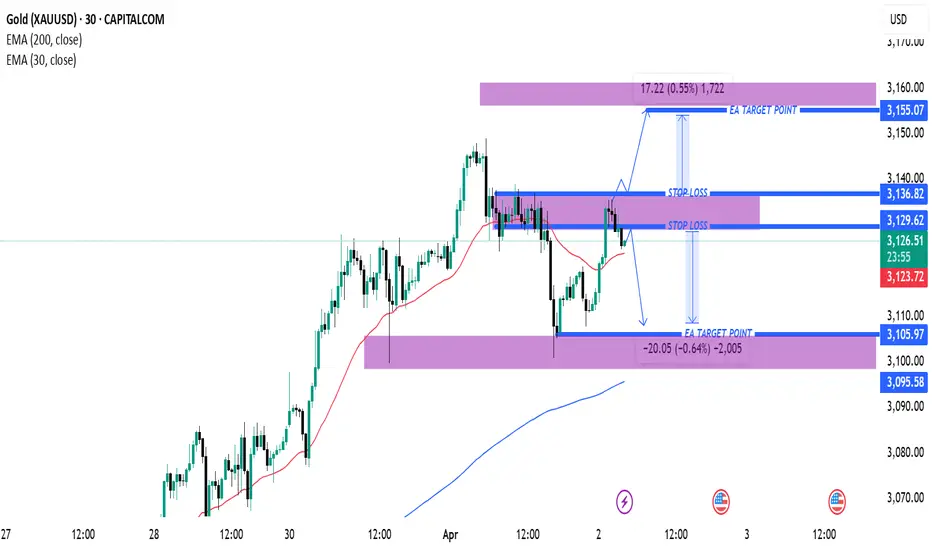
Current price: 3,126.01
Resistance: 3,136.82 (stop-loss level for short trades)
Support: 3,105.97 (target level for short trades)
Another resistance at 3,155.07 (target level for long trades)
Moving Averages:
EMA 200 (blue line): 3,095.57 – Long-term trend indicator; price is above, indicating a bullish bias.
EMA 30 (red line): 3,123.69 – Short-term trend indicator; price is currently near this level.
Trading Strategy:
The chart appears to be showing a possible short trade setup if price rejects resistance at 3,129.62 - 3,136.82.
If price moves below 3,123.69, it could indicate downside momentum toward 3,105.97.
Alternatively, a breakout above 3,136.82 could trigger a move toward 3,155.07.
Risk/Reward Analysis:
Short setup: Entry near 3,129.62, stop-loss around 3,136.82, target 3,105.97.
Long setup: Entry above 3,136.82, stop-loss below 3,129.62, target 3,155.07.
Conclusion:
Bullish Scenario: If price breaks 3,136.82, a move toward 3,155.07 is likely.
Bearish Scenario: If price stays below 3,129.62, it could drop toward 3,105.97.
EMA 30 as dynamic support/resistance: Watch for price reaction around 3,123.69.
Trade closed: target reached
Join my telegram (COPY_TRADE)
t.me/TOP1INVEESTADMEN
Join my refrel broker link
one.exnesstrack.org/a/l1t1rf3p6v
t.me/TOP1INVEESTADMEN
Join my refrel broker link
one.exnesstrack.org/a/l1t1rf3p6v
Disclaimer
The information and publications are not meant to be, and do not constitute, financial, investment, trading, or other types of advice or recommendations supplied or endorsed by TradingView. Read more in the Terms of Use.