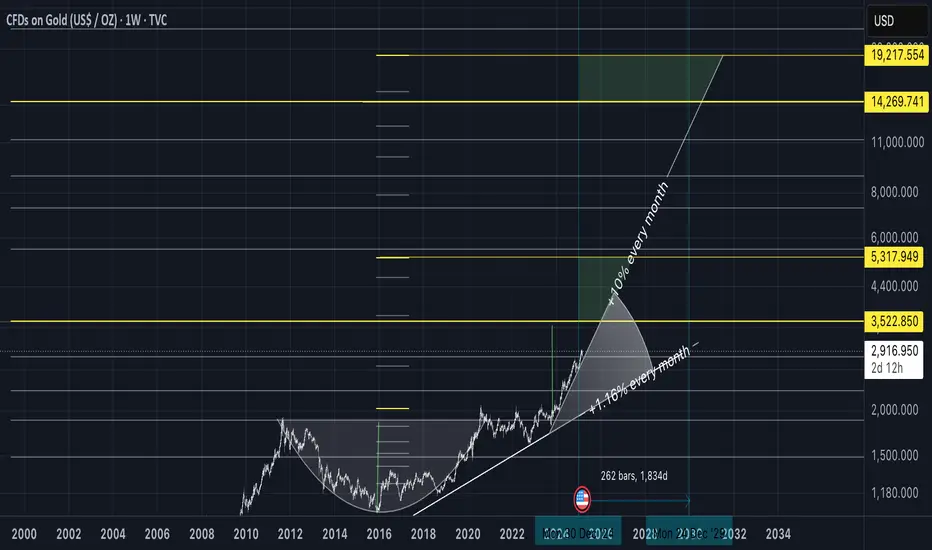
The analysis illustrates a strong bullish trend in Gold prices (XAU/USD) on the weekly timeframe. The chart employs two Fibonacci retracements that identify key support and resistance levels, highlighting crucial zones of price interaction.
The first Fibonacci retracement (larger one) identifies significant long-term targets, notably around $14,270 and $19,217. These represent potential high-value price targets if the upward momentum persists.
The second Fibonacci retracement, drawn from a more recent swing, suggests immediate resistance and potential targets around the price levels of approximately $4,789 and $5,317. These targets represent significant price levels where buyers might take profit or sellers could enter.
The green-shaded area indicates the potential long-term bullish targets, suggesting an extended upward momentum that, if sustained, could propel prices considerably higher, reaching up to around $14,269 and ultimately as high as approximately $19,217.
In summary, the current bullish trajectory, combined with Fibonacci levels and highlighted targets, supports a positive outlook, suggesting continuation towards these higher resistance areas in the medium to long term.
Disclaimer
The information and publications are not meant to be, and do not constitute, financial, investment, trading, or other types of advice or recommendations supplied or endorsed by TradingView. Read more in the Terms of Use.
Disclaimer
The information and publications are not meant to be, and do not constitute, financial, investment, trading, or other types of advice or recommendations supplied or endorsed by TradingView. Read more in the Terms of Use.