At the daily level, the gold price is currently running above the middle track of the Bollinger Band, showing certain strong characteristics. The opening of the Bollinger Band has narrowed slightly, suggesting that price fluctuations may tend to stabilize. The MACD indicator is above the zero axis, the fast and slow lines show signs of adhesion, and the red column kinetic energy has weakened, indicating that although the bulls still have the upper hand, the advantage is shrinking. In terms of the moving average system, the short-term moving average diverges upward, providing certain support for the price, but the deviation rate from the long-term moving average has a trend of shrinking, so be careful of price corrections.
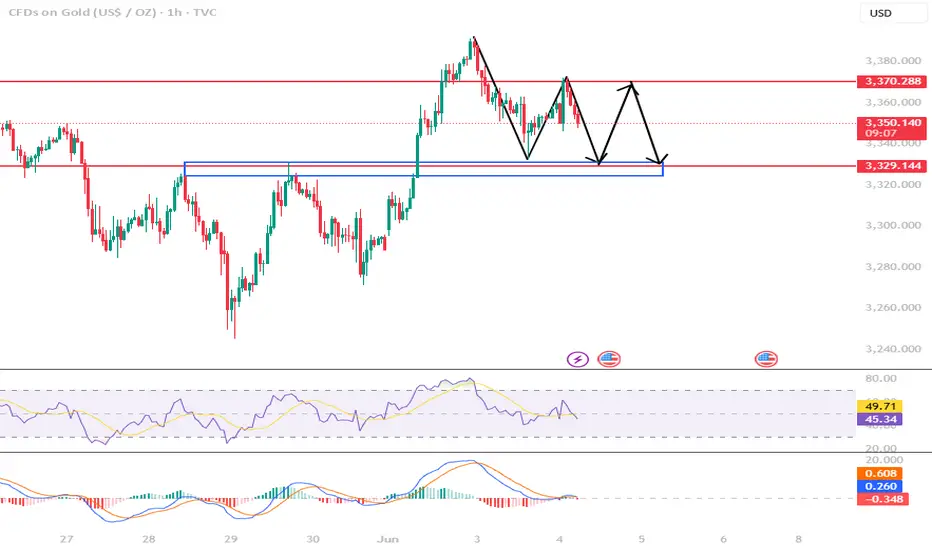
At the 4-hour level, the 5-day moving average crosses the 10-day moving average and runs in a dead cross, the Bollinger Band closes, the MACD indicator golden cross closes, the red kinetic energy column narrows, and the RSI indicator runs in a dead cross after overbought, suggesting that the risk of gold price correction increases. On the hourly line, the price shows a volatile pattern in the short term. The three tracks of the Bollinger Bands are flat, and the price hovers near the middle track, indicating that the long and short forces are temporarily balanced. The RSI indicator fluctuates around 50, which also reflects the market's indecision. In terms of K-line pattern, small negative and positive lines appear continuously, with no obvious trend direction. However, if the hourly price can effectively break through the upper limit of the recent oscillation range of 3400, it is expected to usher in a wave of upward trend in the short term; on the contrary, if it falls below the lower limit of 3300, it may fall further. On the whole, the short-term operation strategy for gold today is recommended to focus on selling on rebounds and buying on pullbacks. The short-term focus on the upper side is the 3370-3375 line of resistance, and the short-term focus on the lower side is the 3330-3325 line of support. The short-term focus on the upper resistance of 3370-3375 is 3370-3375, and the short-term focus on the lower support of 3330-3325 is 3330-3325.
Gold strategy:
Buying range: 3330-3325, SL: 3320, TP: 3350-3360
Selling range: 3370-3375, SL: 3385, TP: 3350-3340
Key points:
First support: 3330, second support: 3325, third support: 3315
First resistance: 3370, second resistance: 3375, third resistance: 3385
Share my views for free every day
Note
Today's strategy is to sell at highs, but the highest is only 3365.Disclaimer
The information and publications are not meant to be, and do not constitute, financial, investment, trading, or other types of advice or recommendations supplied or endorsed by TradingView. Read more in the Terms of Use.
Disclaimer
The information and publications are not meant to be, and do not constitute, financial, investment, trading, or other types of advice or recommendations supplied or endorsed by TradingView. Read more in the Terms of Use.