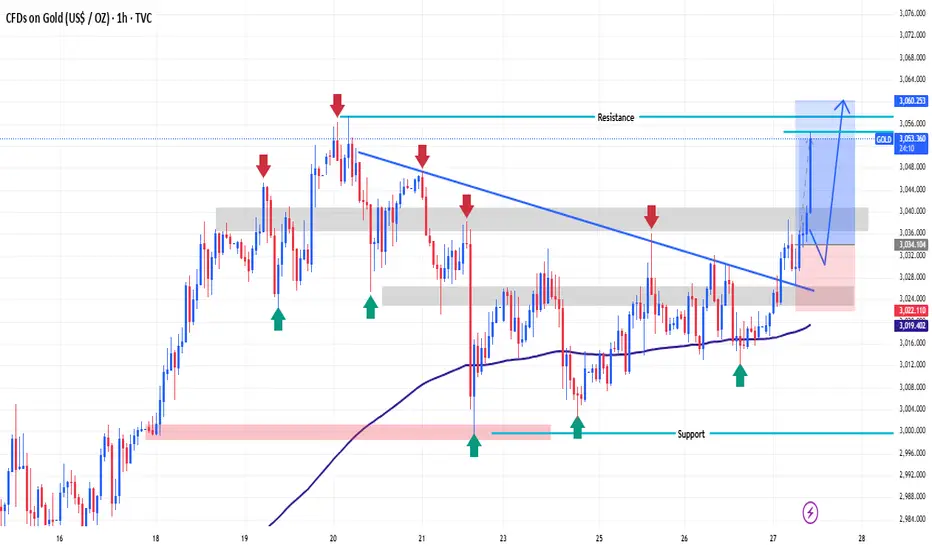
Gold (XAU/USD) highlights a strong bullish move as the price breaks above previous resistance levels. The red arrows mark areas where the price faced resistance in the past, while the blue trendline illustrates a previous downward trend that has now been broken. The price has recently pushed through the resistance zone at 3,060, with the next potential target near 3,064 and 3,070, as shown in the upper part of the chart.
Key support levels are marked with green arrows, indicating where the price found support and reversed its direction. The price is now above these support zones, which suggests that the bullish momentum may continue.
The shaded area in the middle of the chart shows a consolidation range, where the price has been moving sideways. However, a breakout above this zone could lead to further upward movement, as the market has shown strong signs of upward momentum. If the price holds above the support level near 3,019, the target at 3,060 and beyond could be achieved.
Overall, the chart suggests that Gold is in a strong uptrend, and if the support holds, the price could continue moving towards higher targets, possibly reaching 3,064 or even $3,070 in the near future. Traders should watch for potential pullbacks to support areas, as they may provide opportunities to enter long positions.
Trade closed: target reached
Wow target successful TELEGRAM CHANNEL CLICK HERE
👇👇
t.me/addlist/j3ts8pztHtY3NWQ0
VIP SIGNALS SERVICE 👇👇⬇️
t.me/addlist/j3ts8pztHtY3NWQ0
Recommend best broker exness Partner link 👇
one.exnesstrack.org/a/kyponqqh5i
👇👇
t.me/addlist/j3ts8pztHtY3NWQ0
VIP SIGNALS SERVICE 👇👇⬇️
t.me/addlist/j3ts8pztHtY3NWQ0
Recommend best broker exness Partner link 👇
one.exnesstrack.org/a/kyponqqh5i
Related publications
Disclaimer
The information and publications are not meant to be, and do not constitute, financial, investment, trading, or other types of advice or recommendations supplied or endorsed by TradingView. Read more in the Terms of Use.
TELEGRAM CHANNEL CLICK HERE
👇👇
t.me/addlist/j3ts8pztHtY3NWQ0
VIP SIGNALS SERVICE 👇👇⬇️
t.me/addlist/j3ts8pztHtY3NWQ0
Recommend best broker exness Partner link 👇
one.exnesstrack.org/a/kyponqqh5i
👇👇
t.me/addlist/j3ts8pztHtY3NWQ0
VIP SIGNALS SERVICE 👇👇⬇️
t.me/addlist/j3ts8pztHtY3NWQ0
Recommend best broker exness Partner link 👇
one.exnesstrack.org/a/kyponqqh5i
Related publications
Disclaimer
The information and publications are not meant to be, and do not constitute, financial, investment, trading, or other types of advice or recommendations supplied or endorsed by TradingView. Read more in the Terms of Use.
