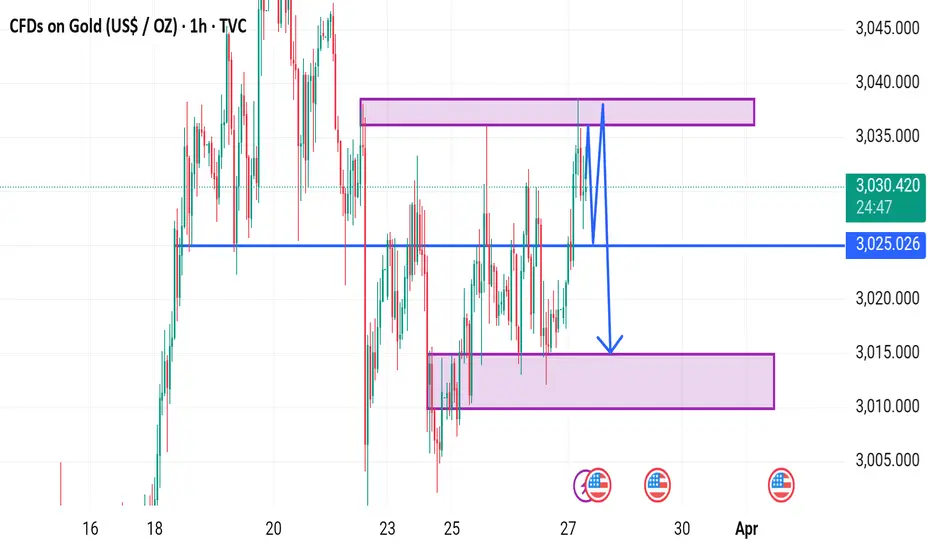
This is a gold price (CFDs on Gold - US$/OZ) chart from TradingView, showing price action on the 1-hour timeframe.
Key Observations:
1. Current Price: Around $3,030.226
2. Key Levels:
Support Zone (~$3,010) marked with a purple rectangle.
Resistance Zone (~$3,040) marked with a purple rectangle.
Key Level at $3,025 (marked with a blue horizontal line).
3. Price Action & Prediction:
The chart suggests a potential rejection at the resistance zone (~$3,040).
A possible retest of the $3,025 level before breaking downward toward the support zone (~$3,010).
The blue zigzag lines indicate expected price movement: a brief consolidation before dropping to the lower zone.
This looks like a bearish setup, where gold might test resistance, fail to break, and decline toward support.
XAUUSD GOLD + BTCUSD Daily 6-7 Free Signals📊🚀
💫Best Trading Team
✅GOLD
✅BTC
✅EURUSD
✅USDJPY
TELEGRAM CHANNEL 👇🏻👇🏻👇🏻👇🏻👇🏻👇🏻
t.me/Gold_Derive_Killer01
💫Best Trading Team
✅GOLD
✅BTC
✅EURUSD
✅USDJPY
TELEGRAM CHANNEL 👇🏻👇🏻👇🏻👇🏻👇🏻👇🏻
t.me/Gold_Derive_Killer01
Disclaimer
The information and publications are not meant to be, and do not constitute, financial, investment, trading, or other types of advice or recommendations supplied or endorsed by TradingView. Read more in the Terms of Use.