Last week, gold prices maintained a bullish trend as market sentiment remained influenced by concerns over Trump's tariffs and the slowdown in U.S. inflation. The uptrend was initially sparked by better-than-expected CPI and PPI figures announced on Wednesday and Thursday, which pushed prices past the descending resistance (1) and the previous high of 2956 (2). Gold surged to a record high of 3004 before stabilizing between 2982 and 2995 ahead of the weekend, ultimately closing the week at 2984.
This week, continue to monitor market risk sentiment, especially regarding a potential ceasefire agreement between Russia and Ukraine. Additionally, the central banks of Japan, the United States, and the United Kingdom will hold meetings on interest rates. Pay close attention to the post-meeting statement on Wed., as the expectation remains for a high-interest-rate environment. S-T market adjustments may occur around that time.
Although there were no major breakthroughs in tariff news last week, gold prices surged after breaking through the descending resistance (1) and the previous historical high (2). This triggered a wave of technical buying and stop-loss orders, driving prices higher.
According to last week's gold futures trading data from the CME Group, the price rally on Tuesday, Wednesday, and Thursday was supported by strong trading volumes, with daily transactions exceeding 250k contracts. This indicated solid upward momentum. However, before the market closed for the weekend and on Monday, trading volume significantly declined, with the latest data showing only 160k contracts traded yesterday.
Although gold has surpassed the 3,000 level, caution is needed as a price correction could occur at any time.
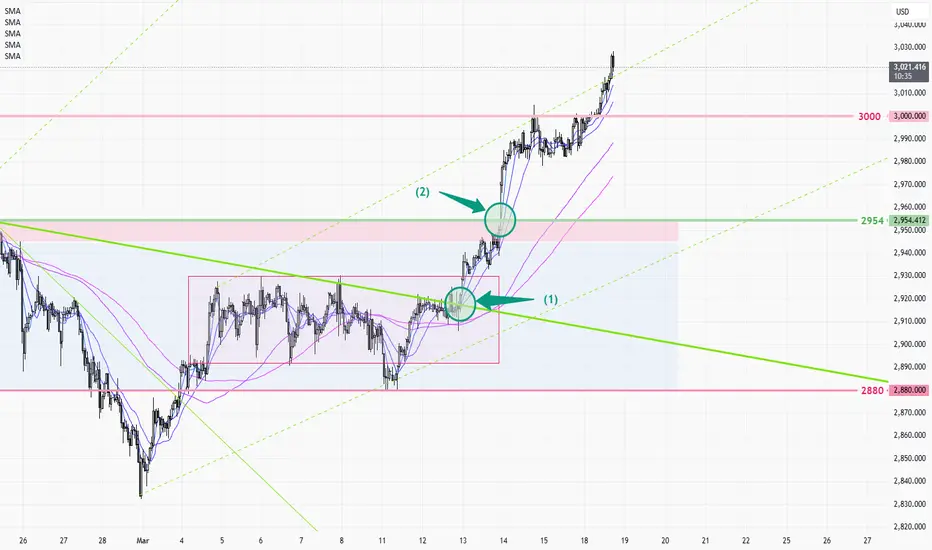
1-hour chart(above) > the uptrend shows no signs of slowing down, and after the Asian market breaks through 3000 on Tuesday, the strategy continues to buy dips. The reversal signal will be that gold prices will fall back below the key support level of 3000.

Daily chart (above) > The support line(3) mentioned last week is still valid; and after breaking the previous high of 2956 (4), the uptrend has restarted on the daily chart. Referencing the previous uptrend(6), the tentative target can be set around 3140. As with the last uptrend, the 5MA will continue to be a buying opportunity after an S-T pullback, and the loss of the 10MA is a signal of a deeper correction.
This week, continue to monitor market risk sentiment, especially regarding a potential ceasefire agreement between Russia and Ukraine. Additionally, the central banks of Japan, the United States, and the United Kingdom will hold meetings on interest rates. Pay close attention to the post-meeting statement on Wed., as the expectation remains for a high-interest-rate environment. S-T market adjustments may occur around that time.
Although there were no major breakthroughs in tariff news last week, gold prices surged after breaking through the descending resistance (1) and the previous historical high (2). This triggered a wave of technical buying and stop-loss orders, driving prices higher.
According to last week's gold futures trading data from the CME Group, the price rally on Tuesday, Wednesday, and Thursday was supported by strong trading volumes, with daily transactions exceeding 250k contracts. This indicated solid upward momentum. However, before the market closed for the weekend and on Monday, trading volume significantly declined, with the latest data showing only 160k contracts traded yesterday.
Although gold has surpassed the 3,000 level, caution is needed as a price correction could occur at any time.
1-hour chart(above) > the uptrend shows no signs of slowing down, and after the Asian market breaks through 3000 on Tuesday, the strategy continues to buy dips. The reversal signal will be that gold prices will fall back below the key support level of 3000.
Daily chart (above) > The support line(3) mentioned last week is still valid; and after breaking the previous high of 2956 (4), the uptrend has restarted on the daily chart. Referencing the previous uptrend(6), the tentative target can be set around 3140. As with the last uptrend, the 5MA will continue to be a buying opportunity after an S-T pullback, and the loss of the 10MA is a signal of a deeper correction.
Disclaimer
The information and publications are not meant to be, and do not constitute, financial, investment, trading, or other types of advice or recommendations supplied or endorsed by TradingView. Read more in the Terms of Use.
Disclaimer
The information and publications are not meant to be, and do not constitute, financial, investment, trading, or other types of advice or recommendations supplied or endorsed by TradingView. Read more in the Terms of Use.