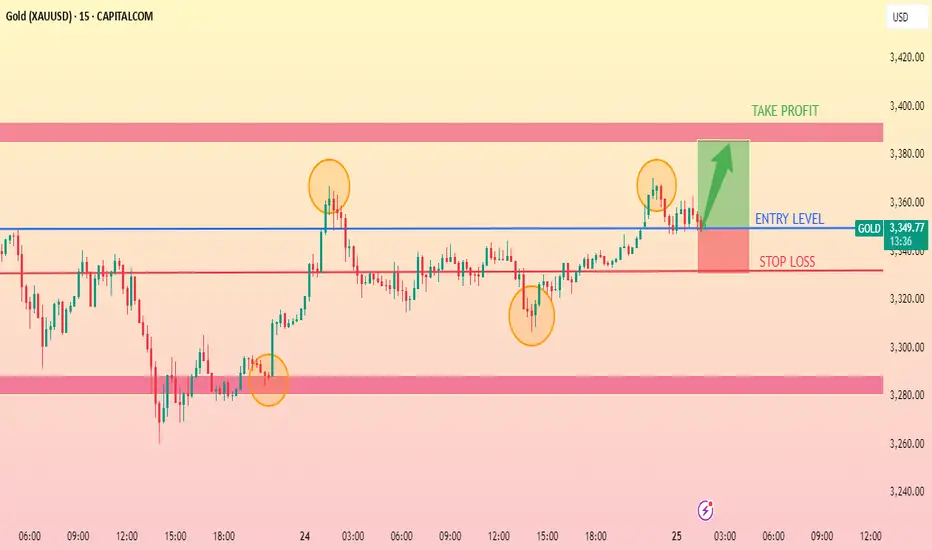
This chart shows a bullish setup for Gold (XAU/USD) on the 15-minute timeframe. Here's a breakdown of the trade idea presented:
Entry Level: Around 3,351.14 USD
Stop Loss: Slightly below the horizontal support zone near 3,335 USD
Take Profit: Targeting the upper resistance zone near 3,395–3,400 USD
Trade Setup: Long (Buy) position
The chart also highlights historical support and resistance levels with orange circles marking key
Trade active
TRADE ACTIVEDisclaimer
The information and publications are not meant to be, and do not constitute, financial, investment, trading, or other types of advice or recommendations supplied or endorsed by TradingView. Read more in the Terms of Use.
Disclaimer
The information and publications are not meant to be, and do not constitute, financial, investment, trading, or other types of advice or recommendations supplied or endorsed by TradingView. Read more in the Terms of Use.