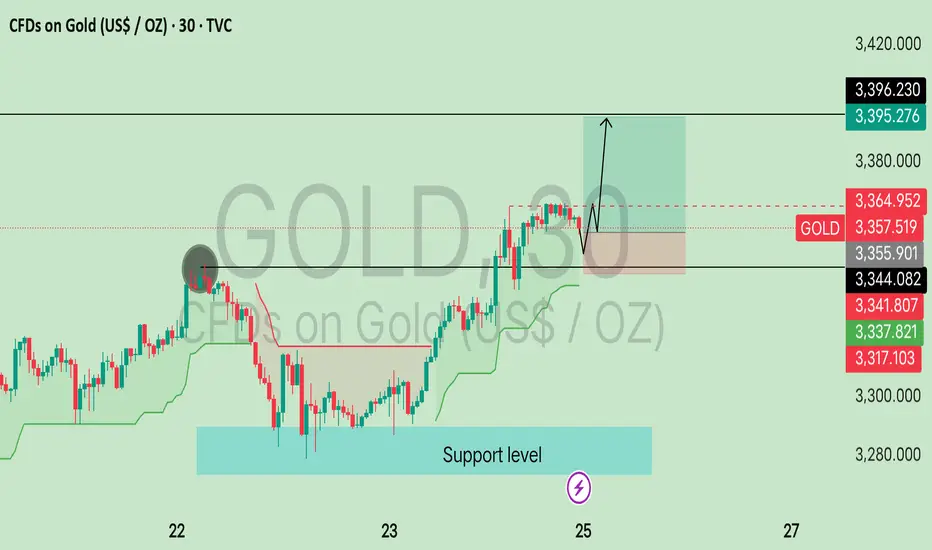
This chart shows the price action of Gold (XAU/USD) on the 30-minute timeframe using TradingView. Here's a breakdown of what the chart indicates:
---
Key Elements:
1. Price Level:
Current price: $3,357.519 per ounce
Price is up +62.852 (+1.91%), indicating a strong recent bullish move.
2. Support Level:
A blue highlighted box labeled “Support level” around the $3,317–$3,338 range shows a key area where price previously found buying interest and bounced back up.
3. Resistance & Breakout:
There's a horizontal black resistance line just above $3,355.901.
The price has broken above this resistance, which is a bullish signal.
4. Bullish Projection:
There’s a black arrow projection, suggesting a possible pullback (retest) to the broken resistance (now support) followed by a continuation upward.
The projected target zone is near $3,396.230.
5. Price Zones:
Green and red price zones on the right show potential entry (buy) and stop-loss levels, supporting the idea of a long (buy) trade setup.
Disclaimer
The information and publications are not meant to be, and do not constitute, financial, investment, trading, or other types of advice or recommendations supplied or endorsed by TradingView. Read more in the Terms of Use.
Disclaimer
The information and publications are not meant to be, and do not constitute, financial, investment, trading, or other types of advice or recommendations supplied or endorsed by TradingView. Read more in the Terms of Use.