It seems like you've shared a set of trading charts showing a trading setup for CFDs on Gold (XAU/USD). Let’s do a quick breakdown of what the charts are highlighting:
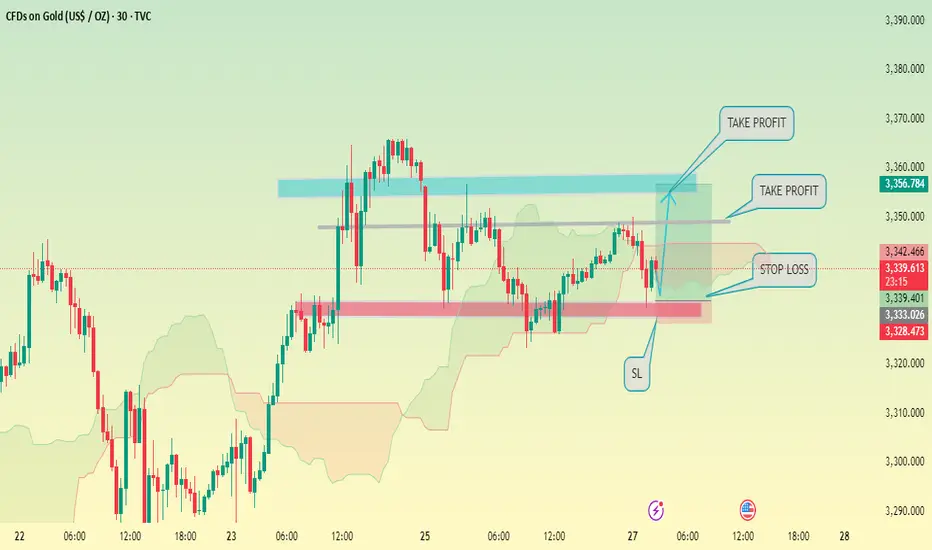
Timeframe: 30-minute chart.
Current Price Zone: Around $3,339–$3,356.
Stop-Loss (SL): Below the highlighted pink support zone, around $3,328.
Take-Profit (TP): Two levels marked within the blue resistance zone — one around $3,350 and another higher at about $3,360.
Trade Bias: Bullish breakout from the support zone (pink) aiming for the resistance zone (blue).
Would you like me to help you with:
Calculating risk/reward ratios?
Confirming if the entry level aligns with the breakout?
Reviewing your trading plan?
Or anything else? Let me know!
Disclaimer
The information and publications are not meant to be, and do not constitute, financial, investment, trading, or other types of advice or recommendations supplied or endorsed by TradingView. Read more in the Terms of Use.
Disclaimer
The information and publications are not meant to be, and do not constitute, financial, investment, trading, or other types of advice or recommendations supplied or endorsed by TradingView. Read more in the Terms of Use.