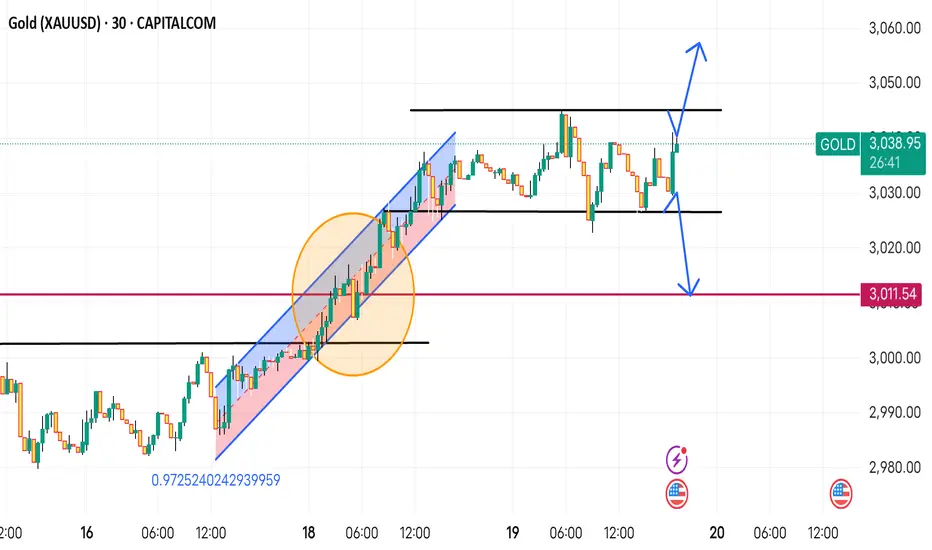
This is a Gold (XAU/USD) 30-minute chart from TradingView, showing a potential trade setup. Here’s what it means:
1. Range Formation:
The price is moving between two key levels (black horizontal lines), indicating consolidation.
2. Breakout or Rejection Scenario:
The blue arrows suggest two possible outcomes:
A break above resistance, leading to further upside.
A rejection at resistance, causing a drop toward the lower support zone.
3. Support Levels:
If the price falls, the next key support is around 3,011.54 (marked in pink).
4. Previous Trend:
The highlighted blue channel (ascending) shows a past bullish move, but now price is in consolidation.
Conclusion: The chart suggests waiting for a breakout or rejection from resistance to decide the next trade direction. If resistance holds, a short trade is possible. If it breaks, a buy setup is confirmed.
Disclaimer
The information and publications are not meant to be, and do not constitute, financial, investment, trading, or other types of advice or recommendations supplied or endorsed by TradingView. Read more in the Terms of Use.
Disclaimer
The information and publications are not meant to be, and do not constitute, financial, investment, trading, or other types of advice or recommendations supplied or endorsed by TradingView. Read more in the Terms of Use.