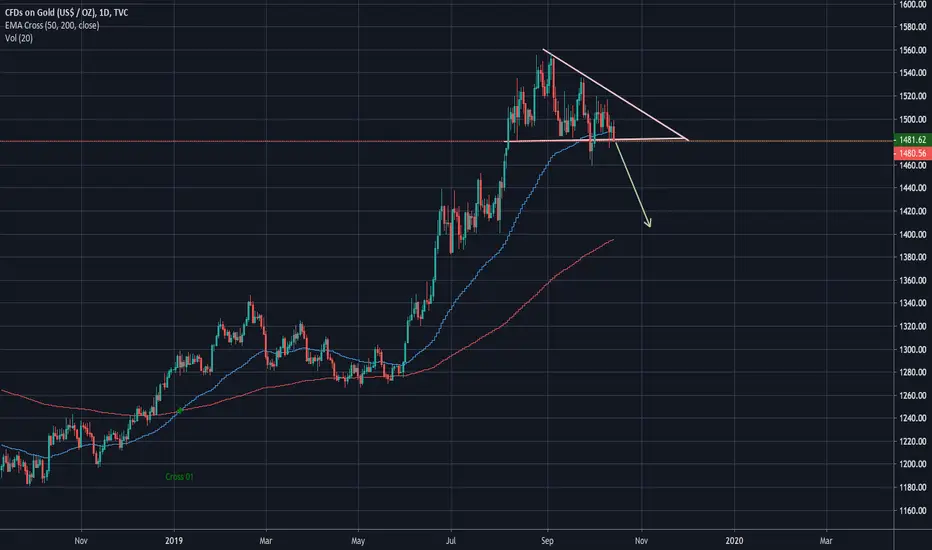
Hello friends, looking at the chart Gold looks like very bearish and seems to go down soon or later.
Here's the reason.
1. Chart pattern
- Drawing lower highs
- Descending triangle
2. Technical indicators
- Overbought zone
Trade with your own risk,
Thank you!
Here's the reason.
1. Chart pattern
- Drawing lower highs
- Descending triangle
2. Technical indicators
- Overbought zone
Trade with your own risk,
Thank you!
Note
Descending triangle is almost completed. Waiting for a signal & Sell.Note
Finally droppinDisclaimer
The information and publications are not meant to be, and do not constitute, financial, investment, trading, or other types of advice or recommendations supplied or endorsed by TradingView. Read more in the Terms of Use.
Disclaimer
The information and publications are not meant to be, and do not constitute, financial, investment, trading, or other types of advice or recommendations supplied or endorsed by TradingView. Read more in the Terms of Use.