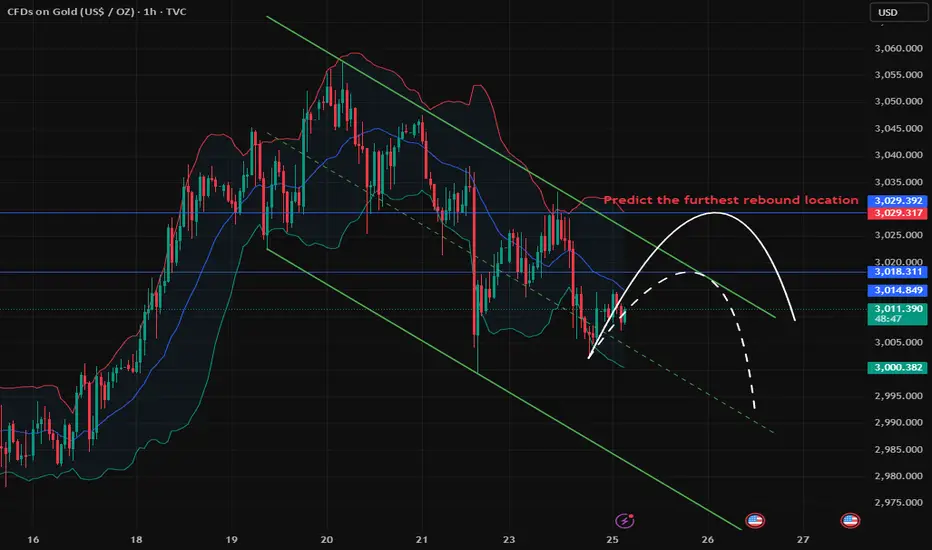
Yesterday, gold hit a high of 3033 before falling back. After the rebound, the downward trend continued. The daily line continued to fall, the RSI indicator turned downward, and the price fell to the current MA10 daily moving average. The price of the four-hour chart and the hourly chart runs along the middle and lower tracks of the Bollinger Bands.
The short-term moving average of the K-line on the 4-hour chart currently maintains a relatively good oscillating downward trend. The current rebound has basically completed the technical form repair. Pay attention to the possible secondary decline trend after the rebound repair is completed.
The current gold daily chart shows that the gold price has peaked and retreated, and the Bollinger Bands are opening downward, but the gold price is still running at a high level. The KDJ indicator on the disk is glued to the upper overbought area to form a dead cross. On Monday, the gold price did not clearly indicate the direction of rise and fall, and it was more in a consolidation pattern. It is recommended to pay attention to the pressure and support of the MA5 and MA10 moving averages in the range of 3035-3000 US dollars, and try to trade with the trend after breaking.
The 4-hour gold chart shows that the SAR indicator resistance point has moved down to around $3035, and the daily MA5 moving average overlaps to form a double suppression in the short term. If the bulls want to restart, they still need to break through this position strongly. If the 4-hour real candle falls below the 3000 mark, refer to last week's low of 2981 and the weekly MA5 moving average support point of 2960. The trading ideas and direction remain unchanged. The main strategy is to sell at high levels and hold in the medium term, and then consider buying at short-term lows!
Key points:
First support: 3002, second support: 2993, third support: 2980
First resistance: 3018, second resistance: 3030, third resistance: 3046
Operation ideas:
Buy: 2990-2993, SL: 2982, TP: 3010-3020;
Sell: 3027-3030, SL: 3038, TP: 3010-3000;
Trade active
Please check, the breakthrough buy has made a profit!🥇My free Telegram group(Updated daily):
t.me/JungoldAnalyst
✅Contact me
t.me/JunCopytrader
t.me/JungoldAnalyst
✅Contact me
t.me/JunCopytrader
Related publications
Disclaimer
The information and publications are not meant to be, and do not constitute, financial, investment, trading, or other types of advice or recommendations supplied or endorsed by TradingView. Read more in the Terms of Use.
🥇My free Telegram group(Updated daily):
t.me/JungoldAnalyst
✅Contact me
t.me/JunCopytrader
t.me/JungoldAnalyst
✅Contact me
t.me/JunCopytrader
Related publications
Disclaimer
The information and publications are not meant to be, and do not constitute, financial, investment, trading, or other types of advice or recommendations supplied or endorsed by TradingView. Read more in the Terms of Use.