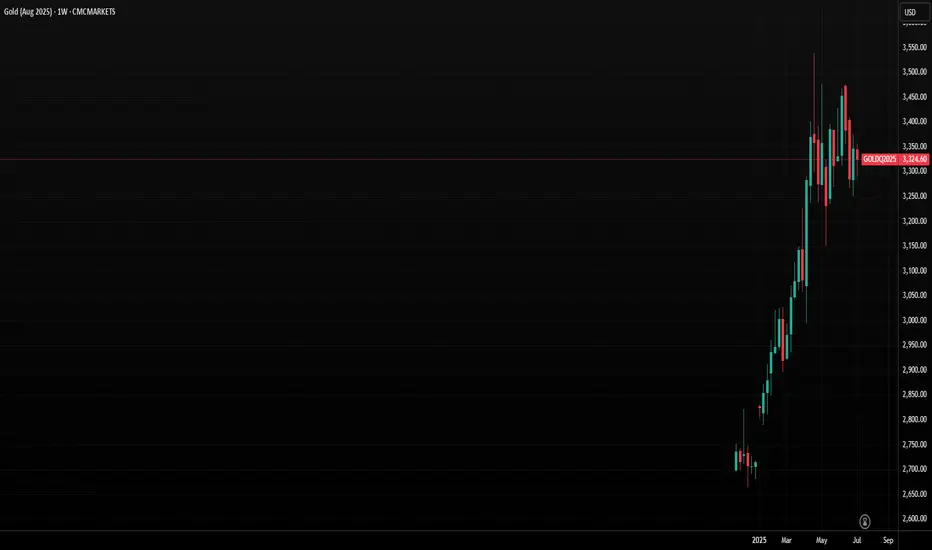
Gold is showing signs of breaking down as the US dollar recovers from a steep decline. Gold and the dollar typically have an inverse relationship over the longer term. The precious metal has been trading sideways since April, but more importantly, it has been trending lower since mid-June. Gold is now approaching a critical juncture, testing an uptrend established in mid-May. Although it has previously held this support level, gold appears likely to break lower this time.

The Trend Lower Is Strengthening
The Relative Strength Index (RSI) is now trending steadily lower, forming a series of lower highs. This suggests that gold’s momentum is currently bearish, indicating potential for continued weakness in the days ahead. To reverse this bearish momentum and shift to a bullish outlook, the RSI would need to rise firmly above 50.
More significantly, gold is now very close to breaking a significant uptrend at $3,300, which was previously tested on June 27 and June 30. On both occasions, the price dipped intraday below this trendline but managed to close above it. The trendline was retested on 8 July, initially holding, but gold is dipping below this critical support level again on 9 July. A close below the trendline on July 9, followed by continued declines starting on July 10, would confirm that the uptrend has broken. This breakdown would signal further downside risk, with initial support at $3,230, followed by $3,170.
Triple Top
Perhaps even more crucially, a triple-top pattern established at the $3,400 becomes increasingly likely each time gold trends lower. The $3,170 support level is particularly significant because it forms the neckline of this triple-top pattern. A decisive break below $3,170 would confirm the triple top pattern and indicate a deeper decline, potentially targeting the range between $2,950 and $3,000.

Written by Michael J. Kramer, founder of Mott Capital Management.
Disclaimer: CMC Markets is an execution-only service provider. The material (whether or not it states any opinions) is for general information purposes only and does not take into account your personal circumstances or objectives. Nothing in this material is (or should be considered to be) financial, investment or other advice on which reliance should be placed.
No opinion given in the material constitutes a recommendation by CMC Markets or the author that any particular investment, security, transaction, or investment strategy is suitable for any specific person. The material has not been prepared in accordance with legal requirements designed to promote the independence of investment research. Although we are not specifically prevented from dealing before providing this material, we do not seek to take advantage of the material prior to its dissemination.
The Trend Lower Is Strengthening
The Relative Strength Index (RSI) is now trending steadily lower, forming a series of lower highs. This suggests that gold’s momentum is currently bearish, indicating potential for continued weakness in the days ahead. To reverse this bearish momentum and shift to a bullish outlook, the RSI would need to rise firmly above 50.
More significantly, gold is now very close to breaking a significant uptrend at $3,300, which was previously tested on June 27 and June 30. On both occasions, the price dipped intraday below this trendline but managed to close above it. The trendline was retested on 8 July, initially holding, but gold is dipping below this critical support level again on 9 July. A close below the trendline on July 9, followed by continued declines starting on July 10, would confirm that the uptrend has broken. This breakdown would signal further downside risk, with initial support at $3,230, followed by $3,170.
Triple Top
Perhaps even more crucially, a triple-top pattern established at the $3,400 becomes increasingly likely each time gold trends lower. The $3,170 support level is particularly significant because it forms the neckline of this triple-top pattern. A decisive break below $3,170 would confirm the triple top pattern and indicate a deeper decline, potentially targeting the range between $2,950 and $3,000.
Written by Michael J. Kramer, founder of Mott Capital Management.
Disclaimer: CMC Markets is an execution-only service provider. The material (whether or not it states any opinions) is for general information purposes only and does not take into account your personal circumstances or objectives. Nothing in this material is (or should be considered to be) financial, investment or other advice on which reliance should be placed.
No opinion given in the material constitutes a recommendation by CMC Markets or the author that any particular investment, security, transaction, or investment strategy is suitable for any specific person. The material has not been prepared in accordance with legal requirements designed to promote the independence of investment research. Although we are not specifically prevented from dealing before providing this material, we do not seek to take advantage of the material prior to its dissemination.
Disclaimer
The information and publications are not meant to be, and do not constitute, financial, investment, trading, or other types of advice or recommendations supplied or endorsed by TradingView. Read more in the Terms of Use.
Disclaimer
The information and publications are not meant to be, and do not constitute, financial, investment, trading, or other types of advice or recommendations supplied or endorsed by TradingView. Read more in the Terms of Use.