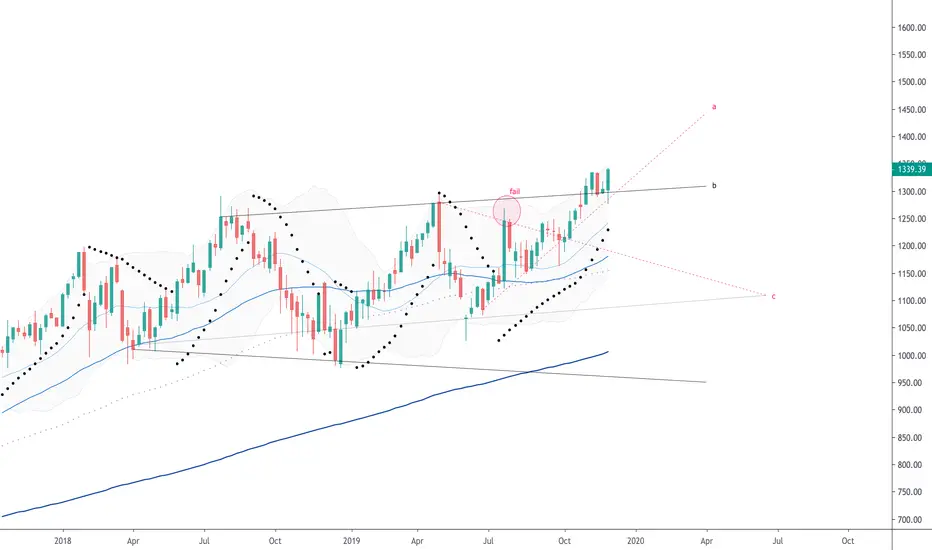
This week's candle closed strong indicating a continuation of the rally, possibly trying to reach for 1400 next. You need to be aware of one issue (marked pink). A distinctive failed reach for the upper formation trend line is a sign of weakness. This could lead to a breakout above (already happened) followed by a sharp reversal around Spring next year. This is interesting because it is echoed by current market technicals (sharp correction in Spring 2020).
Google's candle performance is deceiving and only "appears" bullish, even when it actually is, temporarily. The 'monthly' chart below shows clearly how the stock failed the formation throughout. This is seen when averaging the performance using step-line. The 'monthly' performance alone requires a downward correction of about 30-35% to become neutral again.
All you need to watch out for is the Bollinger Bands. An overshoot with a solid candle (on the 'weekly') and a reversal with another solid candle will be your strong-sell signal. Also look for a 'failed reach' of a solid candle on the upper b-band line.
The stock is bullish as long as it trades above 'a'. Close your long position if it closes below. Strong-Sell if it closes below 'b'.
I never liked this stock's technicals. But it's been requested by a few, so I will revisit this post continuously with updates if there's anything new & mentionable.
Related publications
Disclaimer
The information and publications are not meant to be, and do not constitute, financial, investment, trading, or other types of advice or recommendations supplied or endorsed by TradingView. Read more in the Terms of Use.
Related publications
Disclaimer
The information and publications are not meant to be, and do not constitute, financial, investment, trading, or other types of advice or recommendations supplied or endorsed by TradingView. Read more in the Terms of Use.