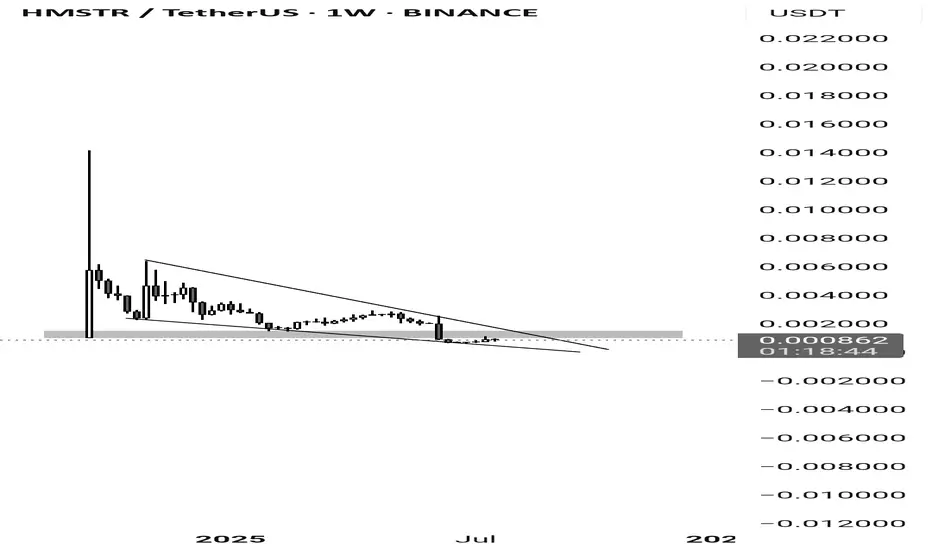
The chart you've shared is for HMSTR/USDT on the weekly (1W) timeframe, and it reveals several notable technical patterns and elements:
🔍 Key Observations:
1. Falling Wedge Pattern:
The price action is forming a falling wedge, which is generally considered a bullish reversal pattern.
The wedge is nearing its apex, indicating a potential breakout soon, either up or down (but statistically, breakouts from falling wedges tend to be upwards).
2. Support Zone:
The price is currently resting on a horizontal support zone (highlighted in grey).
This level has been tested multiple times, indicating it's a strong area of interest for buyers.
3. Volume Consideration (not visible here):
confirmation of a breakout would typically involve increased volume. If volume picks up on a move above the wedge, it could validate a bullish breakout.
4. Current Price:
Price is trading at 0.000858, slightly up by +5.41%, suggesting some early buying interest.
📈 Possible Scenarios:
Bullish Case:
If price breaks above the wedge and holds above the resistance (~0.0010 - 0.0015), it could trigger a trend reversal or a strong upward rally.
Bearish Case:
If price breaks below the support zone and the wedge simultaneously, it could suggest continuation of the downtrend or even a capitulation move.
---
✅ Final Takeaway:
You’re watching a classic falling wedge setup at a key support level, which makes this a high-watch zone. A confirmed breakout (preferably with volume) would be a strong bullish signal. Until then, patience and tight risk management are key.
Disclaimer
The information and publications are not meant to be, and do not constitute, financial, investment, trading, or other types of advice or recommendations supplied or endorsed by TradingView. Read more in the Terms of Use.
Disclaimer
The information and publications are not meant to be, and do not constitute, financial, investment, trading, or other types of advice or recommendations supplied or endorsed by TradingView. Read more in the Terms of Use.