1. Price Action & Bollinger Bands
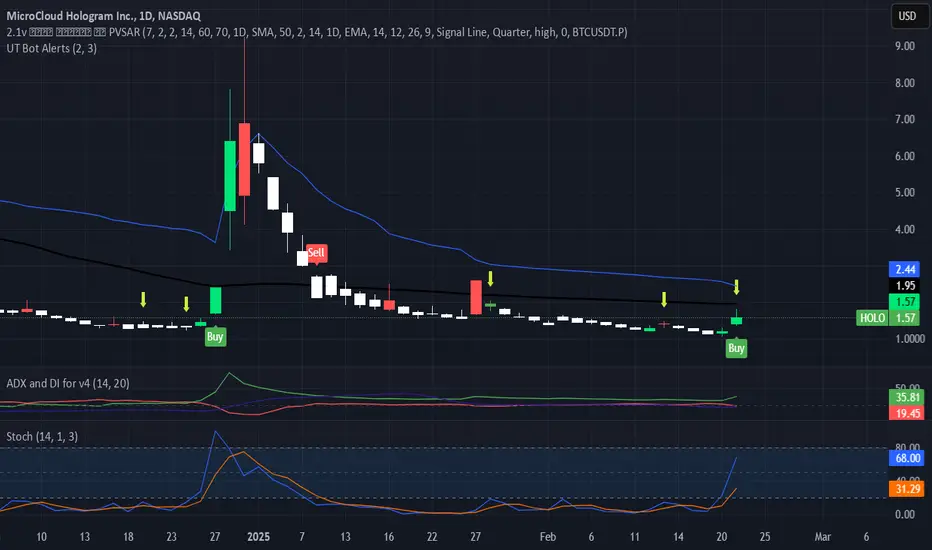
Bollinger Bands: The upper band is around 2.44, the middle (20-day moving average) around 1.57, and the lower band near 0.90.
Current Price: Trading around the lower half of the Bollinger Bands indicates relatively weaker price action in the short term. If price can break back above the middle band (~1.57), it could suggest a stronger bullish reversal attempt.
2. Buy/Sell Signals on Chart
The chart software is showing recent “Buy” labels, possibly triggered by an oversold reading or a bullish crossover of some kind. While these signals can be useful, they’re generally more reliable when combined with other indicators (volume, support/resistance, etc.).
3. ADX and DMI (+DI, –DI)
ADX (~35): This level of ADX suggests a moderately strong trend in place (anything above 25–30 often indicates a more definitive trend).
+DI vs. –DI: With –DI slightly higher than +DI (19.6 vs. 16.9), sellers still have a small edge. However, if +DI crosses above –DI, it may indicate a shift in momentum back to the bulls.
4. Stochastic Oscillator
Stochastic appears to be near or below 20 (oversold territory). That can signal a potential rebound, but oversold conditions can persist in a strong downtrend. A confirmed bullish crossover in Stochastics often adds confidence to a reversal scenario.
5. Support and Resistance Zones
Immediate Support: Near the lower Bollinger Band around 0.90. A breakdown below this zone could lead to further downside.
Resistance: Around the middle Bollinger Band (~1.57). A clear break above 1.57–1.60 with volume could open the door toward the upper Bollinger Band (~2.44).
6. Overall Takeaways
Short-Term Bias: Slightly bearish to neutral, given the price is below the 20-day moving average and the –DI is still above +DI.
Potential Reversal: The oversold Stochastic reading and a “Buy” signal from your chart tool hint at a possible bounce. Watch for a crossover of +DI above –DI and a close above the middle Bollinger band to confirm any bullish momentum.
Risk Management: If you are trading this, consider watching that 0.90 support closely. A decisive break lower could invalidate a near-term bounce.
Disclaimer
The information and publications are not meant to be, and do not constitute, financial, investment, trading, or other types of advice or recommendations supplied or endorsed by TradingView. Read more in the Terms of Use.
Disclaimer
The information and publications are not meant to be, and do not constitute, financial, investment, trading, or other types of advice or recommendations supplied or endorsed by TradingView. Read more in the Terms of Use.