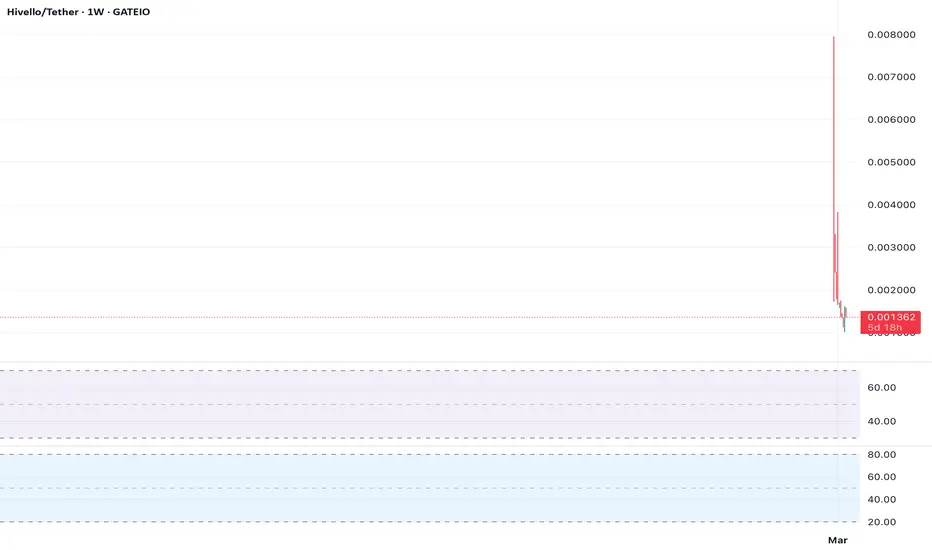
$HVLO on the 4-hour chart is trading between $0.0015 and $0.0018, forming a rectangle pattern. The 20-period EMA is flat, signaling no clear trend, while Bollinger Bands are tight, hinting at a volatility spike. RSI at 50 is neutral, with slight bullish divergence. Volume is steady but low.
A breakout above $0.0018 could target $0.0021; below $0.0015 may hit $0.0013.
Trading Plan: Buy at $0.0016, stop loss at $0.0014, take profit at $0.0018–$0.0021. Short below $0.0015, targeting $0.0013. Watch volume for direction.
A breakout above $0.0018 could target $0.0021; below $0.0015 may hit $0.0013.
Trading Plan: Buy at $0.0016, stop loss at $0.0014, take profit at $0.0018–$0.0021. Short below $0.0015, targeting $0.0013. Watch volume for direction.
Disclaimer
The information and publications are not meant to be, and do not constitute, financial, investment, trading, or other types of advice or recommendations supplied or endorsed by TradingView. Read more in the Terms of Use.
Disclaimer
The information and publications are not meant to be, and do not constitute, financial, investment, trading, or other types of advice or recommendations supplied or endorsed by TradingView. Read more in the Terms of Use.