Low volume lower low and high volume reversal candle.
Here we do not have six months of data but the chart looks pretty clear. It is simple to read.
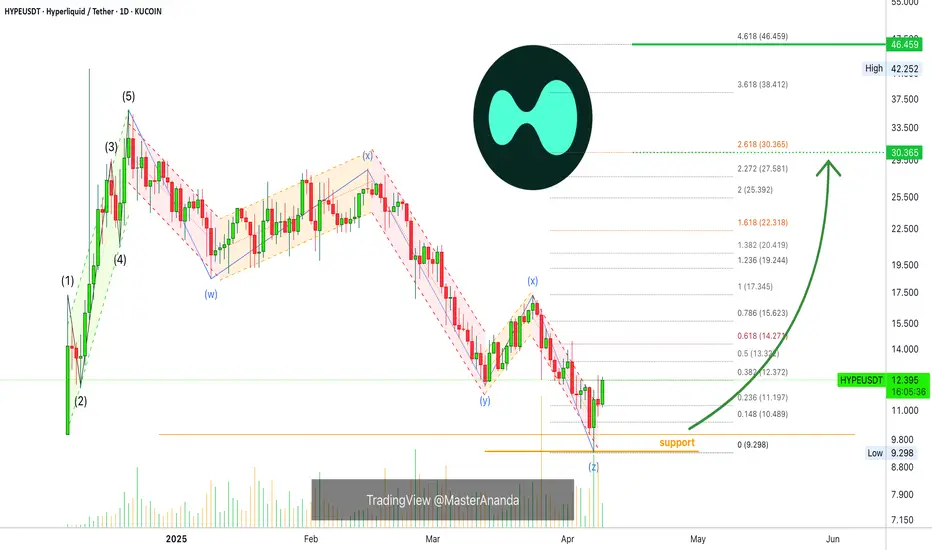
I can spot two perfect 5-waves pattern, one going down and another one going up.
Going down is the second one, the correction, and the session that hit a new bottom ended up as a higher low based on the close. That is, the low in December 2024 is $10. The low 7-April is $9.3 but the close happened at $11.5. ($11.5 higher than $10 [higher low]).
This can be a bullish signal.
Today's candle trades higher than the 13-March low. A full green candle.
After going down, the market tends to reverse and go up. The action is bullish on the short-term and this is a short-term chart.
Hyperliquid is good as long as it trades above support.
"Support" is clearly depicted orange on the chart.
I used this chart setup to open a short-term based trade.
The main targets are 145% & 270% as shown on the chart.
Thank you for reading and for your continued support.
You are appreciated.
Namaste.
Here we do not have six months of data but the chart looks pretty clear. It is simple to read.
I can spot two perfect 5-waves pattern, one going down and another one going up.
Going down is the second one, the correction, and the session that hit a new bottom ended up as a higher low based on the close. That is, the low in December 2024 is $10. The low 7-April is $9.3 but the close happened at $11.5. ($11.5 higher than $10 [higher low]).
This can be a bullish signal.
Today's candle trades higher than the 13-March low. A full green candle.
After going down, the market tends to reverse and go up. The action is bullish on the short-term and this is a short-term chart.
Hyperliquid is good as long as it trades above support.
"Support" is clearly depicted orange on the chart.
I used this chart setup to open a short-term based trade.
The main targets are 145% & 270% as shown on the chart.
Thank you for reading and for your continued support.
You are appreciated.
Namaste.
Note
+56% with multiple targets being hit.HYPEUSDT will continue growing.
Trade active
+133%. There is room for additional growth.Trade closed: target reached
+223%. Enjoy the profits.Namaste.
🚨 FREE PREMIUM Trades + Top Results
t.me/anandatrades/1183
🚨 FREE Quality Content
🏆🏆🏆 New (July 2025) Results
t.me/masteranandatrades/6451
🚨 Go beyond! PREMIUM LIFETIME Access
lamatrades.com (Since 2017)
t.me/anandatrades/1183
🚨 FREE Quality Content
🏆🏆🏆 New (July 2025) Results
t.me/masteranandatrades/6451
🚨 Go beyond! PREMIUM LIFETIME Access
lamatrades.com (Since 2017)
Related publications
Disclaimer
The information and publications are not meant to be, and do not constitute, financial, investment, trading, or other types of advice or recommendations supplied or endorsed by TradingView. Read more in the Terms of Use.