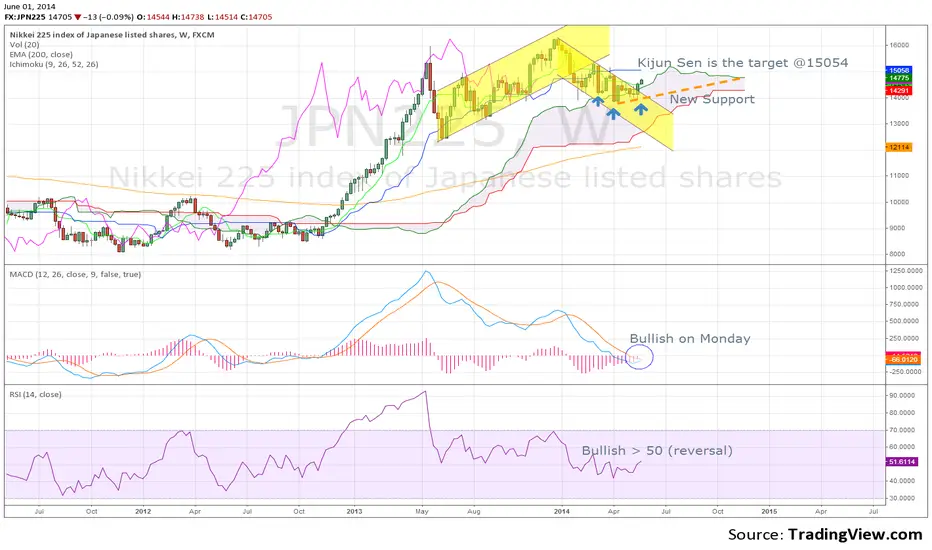
The NIKKEI 225 (JPN225) weekly chart shows the following signs:
Exactly from 6/2013 NIKKEI had been in two channels with different trends. Now it seems to change the trend one more time for upwards. Technically RSI>50 and MACD will be bullish on Monday. Last week the Index with a long candle got over the Tenkan Sen. Next target it seems to be the Kijun Sen at 15054. As you can see in diagram the KUMO offered a strong support to the Index.
I am bullish for NIKKEI except if it returns into the KUMO cloud with a new support line.
Related publications
Disclaimer
The information and publications are not meant to be, and do not constitute, financial, investment, trading, or other types of advice or recommendations supplied or endorsed by TradingView. Read more in the Terms of Use.
Related publications
Disclaimer
The information and publications are not meant to be, and do not constitute, financial, investment, trading, or other types of advice or recommendations supplied or endorsed by TradingView. Read more in the Terms of Use.