📊 JPY/USD 1H Chart Analysis – Rectangle Formation & Bearish Breakout Setup
🔹 1. Chart Context & Price Structure
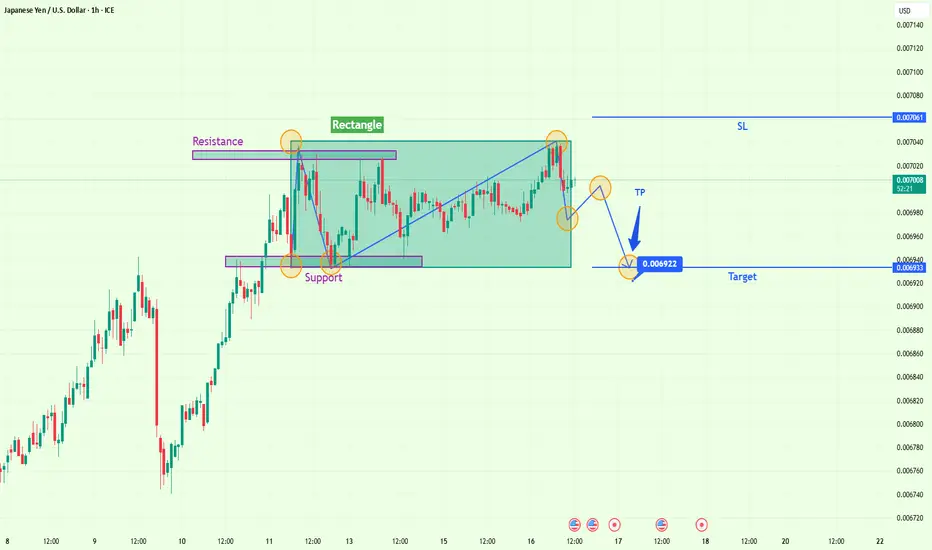
The chart showcases the JPY/USD pair on the 1-hour timeframe, capturing a strong uptrend that entered into a consolidation phase, forming a classic rectangle pattern. This kind of pattern typically reflects market indecision, where neither buyers nor sellers dominate, and it often precedes a continuation or reversal breakout.
🔹 2. Key Technical Elements Identified
✅ Rectangle Pattern (Consolidation Phase)
The pair moves sideways within two horizontal boundaries:
Resistance: ~0.007061
Support: ~0.006933
Multiple price rejections at both levels confirm the integrity of the range.
The rectangle spans several sessions, indicating significant accumulation or distribution.
✅ Support and Resistance Zones
Support Zone: Defined by at least three successful tests around 0.006933.
Resistance Zone: Repeated rejection around the 0.007061 level.
These zones act as barriers, controlling price behavior during consolidation.
✅ Trendline & Mini Bullish Channel
Inside the rectangle, a rising trendline forms a smaller ascending channel, suggesting short-term bullish momentum within the broader sideways structure.
However, price eventually breaks below this trendline, signaling a loss of upward momentum.
🔹 3. Bearish Setup: Breakdown & Trade Plan
Once price breaks below the rectangle support (0.006933), the setup transitions from neutral to bearish.
🔽 Breakout Confirmation:
Price breaks support zone clearly, followed by a retest of the broken support (now turned resistance), forming a bearish rejection.
This is a classic breakout-retest pattern, which enhances the probability of a successful trade.
🎯 Target (TP):
Based on the height of the rectangle, projected downward from the breakout point, the target is set at 0.006922.
This aligns with the next significant minor support and provides a clean technical take-profit zone.
🛑 Stop Loss (SL):
Placed just above the resistance at 0.007061, which invalidates the bearish breakout if broken.
This protects the trade from false breakouts or sudden bullish spikes.
🔹 4. Price Action Confirmation
Bearish Engulfing Candle formed after the retest adds to the confirmation.
Volume (if visible) would typically show a spike during breakout and retest, supporting trade validity.
🔹 5. Trading Psychology Insight
Rectangle patterns often trap both bulls and bears during consolidation. A breakout with retest helps avoid whipsaw trades.
Patience is key in waiting for proper confirmation before entering after the breakout.
📌 Final Trade Setup Summary:
Component Level
Entry Below 0.006933 (confirmed breakout & retest)
Take Profit 0.006922
Stop Loss 0.007061
Risk/Reward Favorable (>1:2)
🔹 1. Chart Context & Price Structure
The chart showcases the JPY/USD pair on the 1-hour timeframe, capturing a strong uptrend that entered into a consolidation phase, forming a classic rectangle pattern. This kind of pattern typically reflects market indecision, where neither buyers nor sellers dominate, and it often precedes a continuation or reversal breakout.
🔹 2. Key Technical Elements Identified
✅ Rectangle Pattern (Consolidation Phase)
The pair moves sideways within two horizontal boundaries:
Resistance: ~0.007061
Support: ~0.006933
Multiple price rejections at both levels confirm the integrity of the range.
The rectangle spans several sessions, indicating significant accumulation or distribution.
✅ Support and Resistance Zones
Support Zone: Defined by at least three successful tests around 0.006933.
Resistance Zone: Repeated rejection around the 0.007061 level.
These zones act as barriers, controlling price behavior during consolidation.
✅ Trendline & Mini Bullish Channel
Inside the rectangle, a rising trendline forms a smaller ascending channel, suggesting short-term bullish momentum within the broader sideways structure.
However, price eventually breaks below this trendline, signaling a loss of upward momentum.
🔹 3. Bearish Setup: Breakdown & Trade Plan
Once price breaks below the rectangle support (0.006933), the setup transitions from neutral to bearish.
🔽 Breakout Confirmation:
Price breaks support zone clearly, followed by a retest of the broken support (now turned resistance), forming a bearish rejection.
This is a classic breakout-retest pattern, which enhances the probability of a successful trade.
🎯 Target (TP):
Based on the height of the rectangle, projected downward from the breakout point, the target is set at 0.006922.
This aligns with the next significant minor support and provides a clean technical take-profit zone.
🛑 Stop Loss (SL):
Placed just above the resistance at 0.007061, which invalidates the bearish breakout if broken.
This protects the trade from false breakouts or sudden bullish spikes.
🔹 4. Price Action Confirmation
Bearish Engulfing Candle formed after the retest adds to the confirmation.
Volume (if visible) would typically show a spike during breakout and retest, supporting trade validity.
🔹 5. Trading Psychology Insight
Rectangle patterns often trap both bulls and bears during consolidation. A breakout with retest helps avoid whipsaw trades.
Patience is key in waiting for proper confirmation before entering after the breakout.
📌 Final Trade Setup Summary:
Component Level
Entry Below 0.006933 (confirmed breakout & retest)
Take Profit 0.006922
Stop Loss 0.007061
Risk/Reward Favorable (>1:2)
Related publications
Disclaimer
The information and publications are not meant to be, and do not constitute, financial, investment, trading, or other types of advice or recommendations supplied or endorsed by TradingView. Read more in the Terms of Use.
Related publications
Disclaimer
The information and publications are not meant to be, and do not constitute, financial, investment, trading, or other types of advice or recommendations supplied or endorsed by TradingView. Read more in the Terms of Use.