📊 JPY/USD – Rising Wedge Breakdown & Bearish Reversal Setup
Chart Type: 45-Minute
Pair: Japanese Yen / U.S. Dollar (JPY/USD)
Published: April 18, 2025
Technical Outlook: Bearish Short-Term Reversal from Rising Wedge Pattern
🧠 1. Market Context & Price Behavior
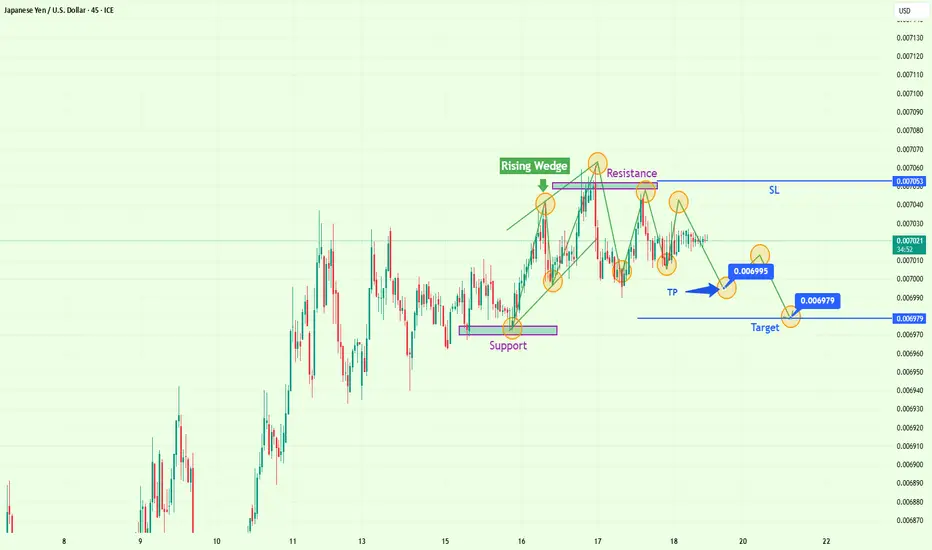
Over the past few sessions, JPY/USD has been in a moderate uptrend, but momentum has gradually started to weaken. The recent price action is characterized by a Rising Wedge, which typically forms during an uptrend and signals a potential bearish reversal.
Buyers were initially in control, pushing the price upward in a structured manner. However, the volume and volatility began to taper, creating divergence between price movement and strength, which is a common precursor to a breakdown in such patterns.
The pair tested the upper resistance region several times without any significant breakout. This multiple rejection at resistance indicates buyer exhaustion, setting the stage for a potential reversal.
🧱 2. Key Technical Zones
🔻 Support Zone – 0.006979
Historical level of interest; previously acted as a base for accumulation before the last rally.
Serves as the target area after the wedge breakdown.
A breakdown to this level would represent a measured move from the wedge height.
🔺 Resistance Zone – 0.007053
Key rejection area, marked by multiple failed breakout attempts.
Represents the Stop Loss (SL) level for short trades.
Also coincides with the previous swing high inside the wedge.
⚠️ Intermediate TP Zone – 0.006995
A minor support formed from recent consolidation.
Could act as a short-term bounce zone before price targets the deeper support.
🧩 3. Chart Pattern: Rising Wedge (Bearish)
A Rising Wedge is formed when price moves upward between converging trendlines. While higher highs and higher lows may seem bullish, the pattern indicates decreasing bullish momentum.
✅ Key Characteristics:
Converging upward-sloping trendlines.
Decreasing volume or momentum.
Break of lower trendline signals bearish reversal.
In this case, the wedge formed after a push from support around 0.006960, peaked near 0.007053, and then broke down with confirmation through a series of lower highs.
🔎 4. Trade Setup & Execution Plan
This setup is based on the wedge breakdown and confirmation of bearish lower highs:
✅ Entry Confirmation:
Breakdown from the lower trendline of the wedge.
Followed by a retest and failure to reclaim broken support, now acting as resistance.
Lower highs indicate strong seller pressure.
🎯 Profit Targets:
TP1: 0.006995 (minor local support zone).
TP2 (Primary Target): 0.006979 (major horizontal support zone, full wedge move).
🛑 Stop-Loss (SL):
0.007053 — safely above the recent resistance and wedge structure to avoid false breakouts.
📏 Risk-to-Reward:
Favorable setup with potential R:R > 2:1, aligning with professional risk management.
📐 5. Candlestick Behavior & Momentum
Notice how recent candles are forming lower highs and smaller bodies, suggesting indecision and exhaustion of bullish strength.
Bearish engulfing patterns and rejection wicks near resistance confirm supply dominance.
Volatility contraction post-wedge suggests a breakout (which occurred to the downside).
Momentum likely to increase as price approaches 0.006990–0.006980 area.
🔮 6. Anticipated Price Action & Trading Psychology
The wedge breakdown confirms a psychological shift: buyers lost steam, and sellers are now controlling the direction. As price tests the 0.007000 psychological level, more traders will be eyeing a breakdown below that figure, triggering additional bearish volume.
The idea is to ride this wave down to the next major liquidity zone at 0.006979, where buyers may regroup or price may consolidate again.
📌 Summary Table
Component Detail
Pattern Rising Wedge (Bearish)
Entry Zone ~0.007020 (post-breakdown)
Stop Loss 0.007053
TP1 0.006995
TP2 (Main Target) 0.006979
Bias Bearish
Timeframe 45-Minute
Trend Context Short-Term Reversal
✅ Final Notes
This is a technically clean and reliable setup, favored by price structure, clear rejection zones, and a pattern-based breakdown. Traders should monitor volume increases near TP zones and adjust stops to break-even once TP1 is reached.
Chart Type: 45-Minute
Pair: Japanese Yen / U.S. Dollar (JPY/USD)
Published: April 18, 2025
Technical Outlook: Bearish Short-Term Reversal from Rising Wedge Pattern
🧠 1. Market Context & Price Behavior
Over the past few sessions, JPY/USD has been in a moderate uptrend, but momentum has gradually started to weaken. The recent price action is characterized by a Rising Wedge, which typically forms during an uptrend and signals a potential bearish reversal.
Buyers were initially in control, pushing the price upward in a structured manner. However, the volume and volatility began to taper, creating divergence between price movement and strength, which is a common precursor to a breakdown in such patterns.
The pair tested the upper resistance region several times without any significant breakout. This multiple rejection at resistance indicates buyer exhaustion, setting the stage for a potential reversal.
🧱 2. Key Technical Zones
🔻 Support Zone – 0.006979
Historical level of interest; previously acted as a base for accumulation before the last rally.
Serves as the target area after the wedge breakdown.
A breakdown to this level would represent a measured move from the wedge height.
🔺 Resistance Zone – 0.007053
Key rejection area, marked by multiple failed breakout attempts.
Represents the Stop Loss (SL) level for short trades.
Also coincides with the previous swing high inside the wedge.
⚠️ Intermediate TP Zone – 0.006995
A minor support formed from recent consolidation.
Could act as a short-term bounce zone before price targets the deeper support.
🧩 3. Chart Pattern: Rising Wedge (Bearish)
A Rising Wedge is formed when price moves upward between converging trendlines. While higher highs and higher lows may seem bullish, the pattern indicates decreasing bullish momentum.
✅ Key Characteristics:
Converging upward-sloping trendlines.
Decreasing volume or momentum.
Break of lower trendline signals bearish reversal.
In this case, the wedge formed after a push from support around 0.006960, peaked near 0.007053, and then broke down with confirmation through a series of lower highs.
🔎 4. Trade Setup & Execution Plan
This setup is based on the wedge breakdown and confirmation of bearish lower highs:
✅ Entry Confirmation:
Breakdown from the lower trendline of the wedge.
Followed by a retest and failure to reclaim broken support, now acting as resistance.
Lower highs indicate strong seller pressure.
🎯 Profit Targets:
TP1: 0.006995 (minor local support zone).
TP2 (Primary Target): 0.006979 (major horizontal support zone, full wedge move).
🛑 Stop-Loss (SL):
0.007053 — safely above the recent resistance and wedge structure to avoid false breakouts.
📏 Risk-to-Reward:
Favorable setup with potential R:R > 2:1, aligning with professional risk management.
📐 5. Candlestick Behavior & Momentum
Notice how recent candles are forming lower highs and smaller bodies, suggesting indecision and exhaustion of bullish strength.
Bearish engulfing patterns and rejection wicks near resistance confirm supply dominance.
Volatility contraction post-wedge suggests a breakout (which occurred to the downside).
Momentum likely to increase as price approaches 0.006990–0.006980 area.
🔮 6. Anticipated Price Action & Trading Psychology
The wedge breakdown confirms a psychological shift: buyers lost steam, and sellers are now controlling the direction. As price tests the 0.007000 psychological level, more traders will be eyeing a breakdown below that figure, triggering additional bearish volume.
The idea is to ride this wave down to the next major liquidity zone at 0.006979, where buyers may regroup or price may consolidate again.
📌 Summary Table
Component Detail
Pattern Rising Wedge (Bearish)
Entry Zone ~0.007020 (post-breakdown)
Stop Loss 0.007053
TP1 0.006995
TP2 (Main Target) 0.006979
Bias Bearish
Timeframe 45-Minute
Trend Context Short-Term Reversal
✅ Final Notes
This is a technically clean and reliable setup, favored by price structure, clear rejection zones, and a pattern-based breakdown. Traders should monitor volume increases near TP zones and adjust stops to break-even once TP1 is reached.
Related publications
Disclaimer
The information and publications are not meant to be, and do not constitute, financial, investment, trading, or other types of advice or recommendations supplied or endorsed by TradingView. Read more in the Terms of Use.
Related publications
Disclaimer
The information and publications are not meant to be, and do not constitute, financial, investment, trading, or other types of advice or recommendations supplied or endorsed by TradingView. Read more in the Terms of Use.