USD/JPY (JPY/USD) Trade Breakdown – Rectangle Pattern & Breakout Strategy
Timeframe: 1H (Hourly)
Chart Type: Candlestick
Date: April 2025
Pair: Japanese Yen / US Dollar (JPY/USD)
Analysis Type: Technical, Price Action
🧱 Phase 1: Rectangle Pattern – The Foundation of the Setup
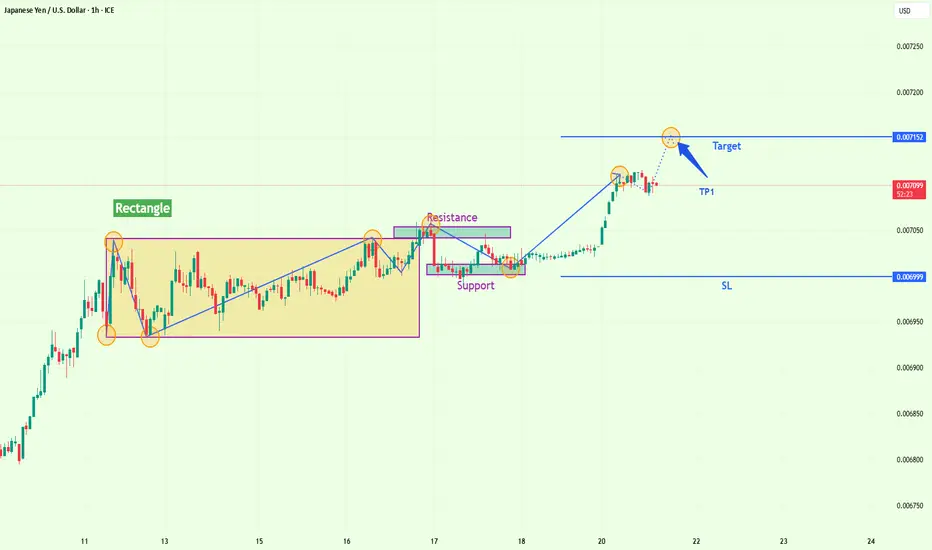
The chart begins with the formation of a rectangle pattern, a classical consolidation or range-bound structure where price is oscillating between defined support and resistance levels. This is typically a neutral pattern that can lead to either a continuation or reversal depending on the breakout direction.
🔲 Key Observations:
Support Level: Price found repeated buying interest at the lower boundary (~0.007030).
Resistance Level: Sellers capped the price around the upper boundary (~0.007110).
This price action creates a balanced market, where supply and demand are temporarily in equilibrium.
💡 Technical Insight:
A rectangle after an uptrend often signals bullish continuation — a pause before further upward momentum.
The longer the consolidation, the stronger the breakout due to the built-up pressure.
🚀 Phase 2: Breakout & Confirmation
Eventually, price broke above the rectangle resistance, validating a bullish breakout.
✅ Breakout Characteristics:
Strong Bullish Candlestick closed above resistance — a clear signal of buyer dominance.
Price retested the previous resistance (now acting as support), which held successfully — this is a critical confirmation step.
🔁 The Retest Concept:
Many professional traders wait for the retest of broken structure for safer entries.
The bounce off the previous resistance confirms that sellers have exited, and the level has flipped to a new demand zone.
📈 Phase 3: Minor Range, Liquidity Sweep & Launch
Post-breakout, price action formed a smaller range — a mini-rectangle — where it briefly paused again.
🟪 Micro Structure:
This zone created a short-term support and resistance, which gave a temporary consolidation before the next impulse.
A wick (false break) below the mini-support likely served as a liquidity sweep or spring — this is where weaker hands are shaken out before the true move.
🧠 Market Psychology:
Liquidity grab techniques are used by institutional players to accumulate orders at better prices.
After trapping sellers, price launched into a sharp bullish rally, confirming the setup.
🎯 Phase 4: Trade Setup, Targets, and Execution Plan
This phase marks the actual trading opportunity based on the setup.
✅ Entry:
After the retest of the breakout zone and a bullish reversal candlestick, a long position becomes valid.
Alternatively, entry could occur on the breakout from the minor range post-retest.
📍 Stop Loss (SL) – 0.006999
Positioned below the swing low and liquidity sweep zone.
Gives the trade room to breathe while invalidating the setup if broken.
🎯 Take Profit 1 (TP1):
Midway between entry and target — allowing for partial profit in case price retraces or fails to reach full target.
🎯 Final Target – 0.007152
This is likely derived using:
A measured move projection from the rectangle breakout.
Historical resistance or key price level.
Fibonacci extension (possibly 1.618 from breakout leg).
⚖️ Risk-Reward Analysis
With the SL set at 0.006999 and the target at 0.007152, the Reward-to-Risk Ratio is highly favorable.
Assuming an entry around 0.007080, this gives:
Risk ≈ 8–10 pips
Reward ≈ 70+ pips
RRR = 7:1 or higher — exceptional from a trading standards point of view.
🔍 Strategic Takeaways
📌 Technical Concepts Applied:
Rectangle Pattern (Consolidation)
Breakout and Retest Principle
Support & Resistance Flip
Minor Range Liquidity Sweep
Measured Move Targeting
🧠 Psychology & Price Action Behavior:
Institutions often use false breaks to trap retail traders.
Retests offer low-risk, high-reward entries.
Well-defined structures like rectangles provide clarity and planning confidence.
📘 Summary – Full Trade Recap
Component Details
Pattern Rectangle Breakout
Type Continuation (Bullish)
Entry Criteria Retest of broken resistance or micro-range breakout
Stop Loss (SL) 0.006999 (below recent swing low)
TP1 Intermediate profit zone
Final Target 0.007152
Risk-Reward Ratio 4:1 to 7:1 (depending on entry point)
Strategy Used Breakout-Retest-Continuation
Timeframe 1-Hour (Intraday to short swing trade)
🛠 Suggested Enhancements for Traders:
Use volume confirmation on the breakout (e.g., spike in volume at breakout).
Apply a trailing stop after TP1 is hit to secure additional profits.
Use multiple timeframe analysis to align with larger trend direction (e.g., check 4H or Daily).
Timeframe: 1H (Hourly)
Chart Type: Candlestick
Date: April 2025
Pair: Japanese Yen / US Dollar (JPY/USD)
Analysis Type: Technical, Price Action
🧱 Phase 1: Rectangle Pattern – The Foundation of the Setup
The chart begins with the formation of a rectangle pattern, a classical consolidation or range-bound structure where price is oscillating between defined support and resistance levels. This is typically a neutral pattern that can lead to either a continuation or reversal depending on the breakout direction.
🔲 Key Observations:
Support Level: Price found repeated buying interest at the lower boundary (~0.007030).
Resistance Level: Sellers capped the price around the upper boundary (~0.007110).
This price action creates a balanced market, where supply and demand are temporarily in equilibrium.
💡 Technical Insight:
A rectangle after an uptrend often signals bullish continuation — a pause before further upward momentum.
The longer the consolidation, the stronger the breakout due to the built-up pressure.
🚀 Phase 2: Breakout & Confirmation
Eventually, price broke above the rectangle resistance, validating a bullish breakout.
✅ Breakout Characteristics:
Strong Bullish Candlestick closed above resistance — a clear signal of buyer dominance.
Price retested the previous resistance (now acting as support), which held successfully — this is a critical confirmation step.
🔁 The Retest Concept:
Many professional traders wait for the retest of broken structure for safer entries.
The bounce off the previous resistance confirms that sellers have exited, and the level has flipped to a new demand zone.
📈 Phase 3: Minor Range, Liquidity Sweep & Launch
Post-breakout, price action formed a smaller range — a mini-rectangle — where it briefly paused again.
🟪 Micro Structure:
This zone created a short-term support and resistance, which gave a temporary consolidation before the next impulse.
A wick (false break) below the mini-support likely served as a liquidity sweep or spring — this is where weaker hands are shaken out before the true move.
🧠 Market Psychology:
Liquidity grab techniques are used by institutional players to accumulate orders at better prices.
After trapping sellers, price launched into a sharp bullish rally, confirming the setup.
🎯 Phase 4: Trade Setup, Targets, and Execution Plan
This phase marks the actual trading opportunity based on the setup.
✅ Entry:
After the retest of the breakout zone and a bullish reversal candlestick, a long position becomes valid.
Alternatively, entry could occur on the breakout from the minor range post-retest.
📍 Stop Loss (SL) – 0.006999
Positioned below the swing low and liquidity sweep zone.
Gives the trade room to breathe while invalidating the setup if broken.
🎯 Take Profit 1 (TP1):
Midway between entry and target — allowing for partial profit in case price retraces or fails to reach full target.
🎯 Final Target – 0.007152
This is likely derived using:
A measured move projection from the rectangle breakout.
Historical resistance or key price level.
Fibonacci extension (possibly 1.618 from breakout leg).
⚖️ Risk-Reward Analysis
With the SL set at 0.006999 and the target at 0.007152, the Reward-to-Risk Ratio is highly favorable.
Assuming an entry around 0.007080, this gives:
Risk ≈ 8–10 pips
Reward ≈ 70+ pips
RRR = 7:1 or higher — exceptional from a trading standards point of view.
🔍 Strategic Takeaways
📌 Technical Concepts Applied:
Rectangle Pattern (Consolidation)
Breakout and Retest Principle
Support & Resistance Flip
Minor Range Liquidity Sweep
Measured Move Targeting
🧠 Psychology & Price Action Behavior:
Institutions often use false breaks to trap retail traders.
Retests offer low-risk, high-reward entries.
Well-defined structures like rectangles provide clarity and planning confidence.
📘 Summary – Full Trade Recap
Component Details
Pattern Rectangle Breakout
Type Continuation (Bullish)
Entry Criteria Retest of broken resistance or micro-range breakout
Stop Loss (SL) 0.006999 (below recent swing low)
TP1 Intermediate profit zone
Final Target 0.007152
Risk-Reward Ratio 4:1 to 7:1 (depending on entry point)
Strategy Used Breakout-Retest-Continuation
Timeframe 1-Hour (Intraday to short swing trade)
🛠 Suggested Enhancements for Traders:
Use volume confirmation on the breakout (e.g., spike in volume at breakout).
Apply a trailing stop after TP1 is hit to secure additional profits.
Use multiple timeframe analysis to align with larger trend direction (e.g., check 4H or Daily).
Related publications
Disclaimer
The information and publications are not meant to be, and do not constitute, financial, investment, trading, or other types of advice or recommendations supplied or endorsed by TradingView. Read more in the Terms of Use.
Related publications
Disclaimer
The information and publications are not meant to be, and do not constitute, financial, investment, trading, or other types of advice or recommendations supplied or endorsed by TradingView. Read more in the Terms of Use.