Analysis of the Chart (Jindal Stainless Ltd - NSE, Weekly Timeframe)
1. Elliott Wave Structure
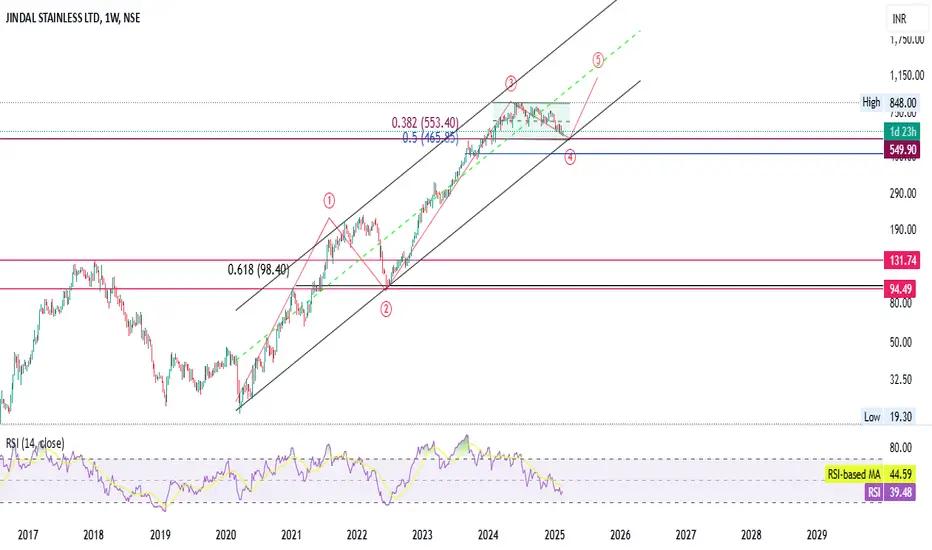
Wave (1) and (2) are complete.
Wave (3) reached its peak and Wave (4) is forming, finding support near 549.90 INR (highlighted blue line).
Wave (5) projection: The chart suggests a possible bullish move from Wave (4) to Wave (5), targeting new highs.
2. Fibonacci Retracement Levels
0.382 (553.40 INR) and 0.5 (465.85 INR) are key Fibonacci levels.
Current support: The stock is bouncing from the 0.382 Fibonacci retracement level, indicating a potential reversal zone.
If this level fails, the next major support is near 465 INR (0.5 level).
3. Price Action & Trendline Support
The stock has been following an ascending channel, touching both the upper and lower trendlines.
Currently, the price is near the lower boundary of the channel, which historically has acted as a strong support.
A breakout above the mid-line of the channel could trigger Wave (5) rally.
4. RSI (Relative Strength Index)
The RSI is 39.48, indicating mildly oversold conditions.
The RSI-based moving average is 44.59, showing weakness but also potential for reversal.
If RSI crosses above 50, it could signal bullish momentum.
5. Key Levels to Watch
Immediate Support: 549.90 INR (current bounce level)
Major Support: 465.85 INR (0.5 Fibonacci level)
Resistance Levels:
605-610 INR (recent highs)
848 INR (previous peak & target for Wave 5)
Conclusion
✅ Bullish Scenario: If the price holds 549 INR support and RSI improves, a potential Wave 5 rally could push the stock towards 700-850 INR in the coming months.
❌ Bearish Scenario: A breakdown below 465 INR could signal further downside towards 350-400 INR.
1. Elliott Wave Structure
Wave (1) and (2) are complete.
Wave (3) reached its peak and Wave (4) is forming, finding support near 549.90 INR (highlighted blue line).
Wave (5) projection: The chart suggests a possible bullish move from Wave (4) to Wave (5), targeting new highs.
2. Fibonacci Retracement Levels
0.382 (553.40 INR) and 0.5 (465.85 INR) are key Fibonacci levels.
Current support: The stock is bouncing from the 0.382 Fibonacci retracement level, indicating a potential reversal zone.
If this level fails, the next major support is near 465 INR (0.5 level).
3. Price Action & Trendline Support
The stock has been following an ascending channel, touching both the upper and lower trendlines.
Currently, the price is near the lower boundary of the channel, which historically has acted as a strong support.
A breakout above the mid-line of the channel could trigger Wave (5) rally.
4. RSI (Relative Strength Index)
The RSI is 39.48, indicating mildly oversold conditions.
The RSI-based moving average is 44.59, showing weakness but also potential for reversal.
If RSI crosses above 50, it could signal bullish momentum.
5. Key Levels to Watch
Immediate Support: 549.90 INR (current bounce level)
Major Support: 465.85 INR (0.5 Fibonacci level)
Resistance Levels:
605-610 INR (recent highs)
848 INR (previous peak & target for Wave 5)
Conclusion
✅ Bullish Scenario: If the price holds 549 INR support and RSI improves, a potential Wave 5 rally could push the stock towards 700-850 INR in the coming months.
❌ Bearish Scenario: A breakdown below 465 INR could signal further downside towards 350-400 INR.
Disclaimer
The information and publications are not meant to be, and do not constitute, financial, investment, trading, or other types of advice or recommendations supplied or endorsed by TradingView. Read more in the Terms of Use.
Disclaimer
The information and publications are not meant to be, and do not constitute, financial, investment, trading, or other types of advice or recommendations supplied or endorsed by TradingView. Read more in the Terms of Use.