Hi, iJustCoiners!
LINKUSD looks stronger than other coins and it's still experiencing upward pressure short-term.
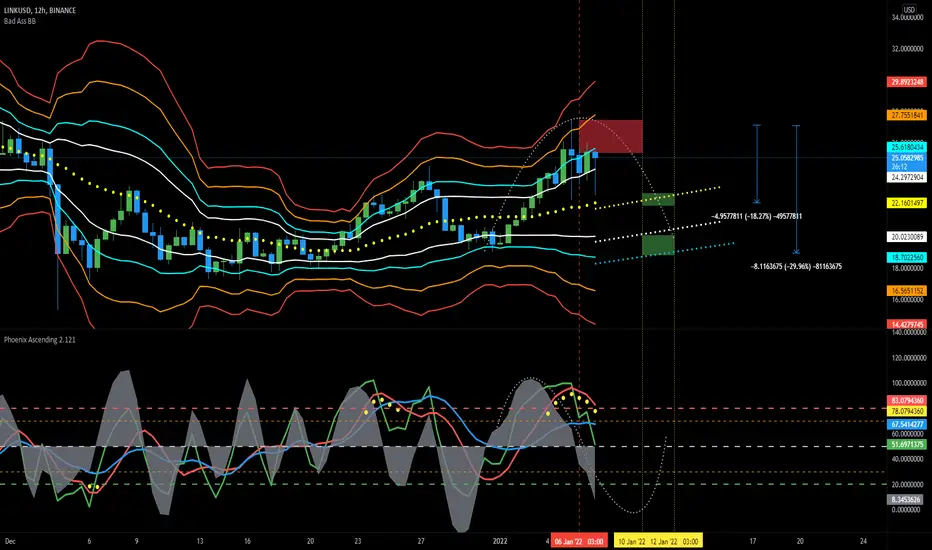
At this 12H chart we can see that BLUE LSMA is quite high, that's why we HOLD White Upper/Yellow Basis as our support at the moment.
However when this Blue LSMA fell down below level 70 with Red RSI we will be in a subject to loose this support and dip down. Dip down to where?
I pointed at the chart with the Red Rectangle a Sell Area for a short entry and with the Green Rectangles i pointed 2 buying areas, where you may consider to close your short position.
With Red RSI and LSMA so high they should act as our solid support.
LINKUSD looks stronger than other coins and it's still experiencing upward pressure short-term.
At this 12H chart we can see that BLUE LSMA is quite high, that's why we HOLD White Upper/Yellow Basis as our support at the moment.
However when this Blue LSMA fell down below level 70 with Red RSI we will be in a subject to loose this support and dip down. Dip down to where?
I pointed at the chart with the Red Rectangle a Sell Area for a short entry and with the Green Rectangles i pointed 2 buying areas, where you may consider to close your short position.
With Red RSI and LSMA so high they should act as our solid support.
Note
You may consider to close a trade around $25.6 if you're scalpingNote
We are very close to the reversal momentum. 1D Energy is going down. 12H is slightly above level 50. 3H and 6H are peaking. WE should watch closely 90M timeframe for a price entry.Note
The same chart, but with my vertical lines and rectangles.Note
That will be as well nice swing trade using NEAR TERM timeframe. We are at the top of the 4D/8D cycle.Note
Downward pressure has been triggered at 90M, my assistant indicators turned PURPLE indicating a potential reversal momentNote
Probably we just HAD our LPSY. And one who is shorting should've been adding up to his HOSRT position here.That's the chart from Wyckoff Schematcis point of view as i see it. I am not good at it yet, but i trying to use it
Note
90M,3H,6H,12H are showing DOWNWARD PRESSURE. Now we finally got enough strenght to reverse the daily. If we are going to see another dip on BTC i am sure that will help to buy back LINK at $18-$20 pric levels if not even lowerNote
The 6H is close to cross below 50. 45M,90M,3H going down i assumed they will kill it during this push down, but White Upper on the 12H holds because of LSMA slightly below 80RSI already dipped below LSMA providing a set up for a move down at the 12H. At the 1D RSI is very close to cross LSMA
Note
We are finally got a chance to hit Yellow Bband Basis on the daily which around $23 level. Blue LSMA is so high it keeps provding us White Upper as a support. But probably next candle it will fall down below level 80, so we will be able to touch $23 and probably even wick down to the White Lower. But i expect the daily to close above Yellow Bband Basis on the dailyNote
Decesive moment. If close below that GOLDEN line, it goes down. Look at how this was acting as support. Candles were closing ABOVE this GOLDEN support line.
Note
Short-term group of timeframes diving below level 50. It's the last call for bull on my opinion. If we do not go up from here we must be ready to load our bags at lower levels. I personally entered a short tradeNote
LINK Marines surrenderedNote
This move up was epxected based on 1D LSMA above level 70, providing us strength to rise up the Yellow Bband at the 12H TF. This might be a nice short entry if you are still not in a trade or you might consider to add up to your short position. However i'd still recommend you to wait untill we see 90M and 3H White Energy below level 50. Looking at the 6H and 12H LSMA i might say that we defineteyly will see a pullback to $23 level again. I expect $21 to be our new low. That also goes in tact with 1D White Lower Bband wich i expect to act as a supportNote
This LINK short takes a lot of patience. BTC going sideways providig a COMPOSITE MAN the time to PUMP ALTS and make money selling them by the top dollar.If you are holding LONG position you don't want 3H,6H and 12H White Energy to fell below 50. Once 12H White Energy goes below 50 the price action might go down steeply. I am telling that based on BLue LSMA and Red RSI below level 50 at 6H and 12H. With these indicators so low downward pressure will continue until White Energy will get back to level 50 again.
Until White Energy stays above 50 LINK bulls have hope.
I pointed 3H, 6H, 12H WHite Energy with the Blue Circles.
Related publications
Disclaimer
The information and publications are not meant to be, and do not constitute, financial, investment, trading, or other types of advice or recommendations supplied or endorsed by TradingView. Read more in the Terms of Use.
Related publications
Disclaimer
The information and publications are not meant to be, and do not constitute, financial, investment, trading, or other types of advice or recommendations supplied or endorsed by TradingView. Read more in the Terms of Use.