Recently, LTCBTC is getting stronger, which increases the possibility of higher growth.
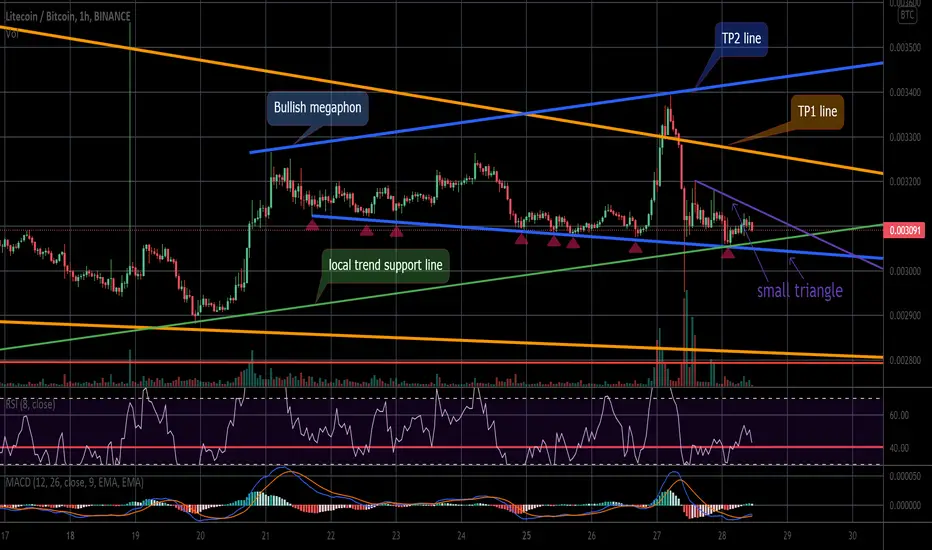
As can be seen on the 1h chart, a small local triangle (blue and violet lines) is formed. A bullish megaphon pattern (blue lines) was also formed.
The price has repeatedly failed to break down the megaphone pattern, which tells us that there will probably be a break up.
If the LTCBTC breaks the triangle upwards (violet line) it will be a long sign.
For a long wait for the violet line to break through:
TP1-orange resistance line.
TP2-blue resistance line
Disclamer: This is not financial advice.
You trade at your own risk.
Related publications
Disclaimer
The information and publications are not meant to be, and do not constitute, financial, investment, trading, or other types of advice or recommendations supplied or endorsed by TradingView. Read more in the Terms of Use.
Related publications
Disclaimer
The information and publications are not meant to be, and do not constitute, financial, investment, trading, or other types of advice or recommendations supplied or endorsed by TradingView. Read more in the Terms of Use.