LTC/USDT Technical Analysis: Bullish Breakout Targeting $473.17
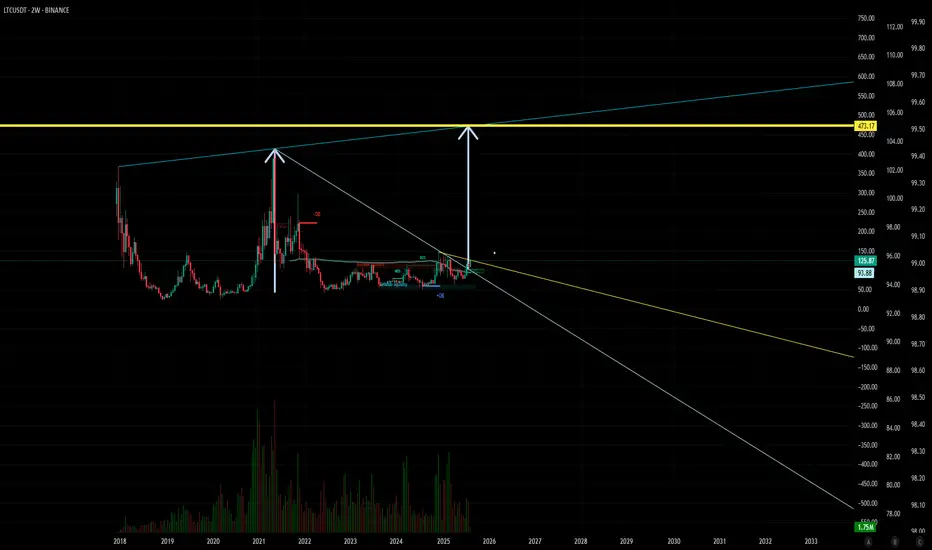
This chart presents a long-term bullish forecast for Litecoin (LTC/USDT) on the 2-week timeframe. The analysis suggests that LTC is on the verge of completing a multi-year consolidation pattern, with a potential for a significant upward price movement.
Key Observations:
Macro Symmetrical Triangle: The chart highlights a massive symmetrical triangle pattern that has been forming for approximately seven years (from 2018 to 2025). This pattern is defined by a descending trendline connecting the major highs and an ascending trendline connecting the major lows, indicating a long period of price contraction and energy accumulation.
Bullish Breakout: The analysis projects a breakout from the upper resistance of this triangle around mid-2025. A breakout from such a long-term consolidation pattern is considered a powerful bullish signal, suggesting the end of the sideways/downtrend and the beginning of a new major rally.
Price Target Activated: The primary target for this bullish move is set at $473.17. This price level corresponds to the historical all-time high of May 2021. After a major pattern breakout, it is common for price to target previous significant highs where "buyside liquidity" is presumed to rest. The text "473 target activated" implies that the breakout event is the trigger that sets this price objective in motion.
In summary, the chart illustrates a scenario where LTC breaks out of a multi-year consolidation, leading to a powerful rally with the ultimate target of reclaiming its previous all-time high of $473.17.
Disclaimer
The information and publications are not meant to be, and do not constitute, financial, investment, trading, or other types of advice or recommendations supplied or endorsed by TradingView. Read more in the Terms of Use.
Disclaimer
The information and publications are not meant to be, and do not constitute, financial, investment, trading, or other types of advice or recommendations supplied or endorsed by TradingView. Read more in the Terms of Use.