MATIC Falls To Monthly Low, Will Bulls Hold The $1.00 Support?
-MATIC has fallen over -15% the last week
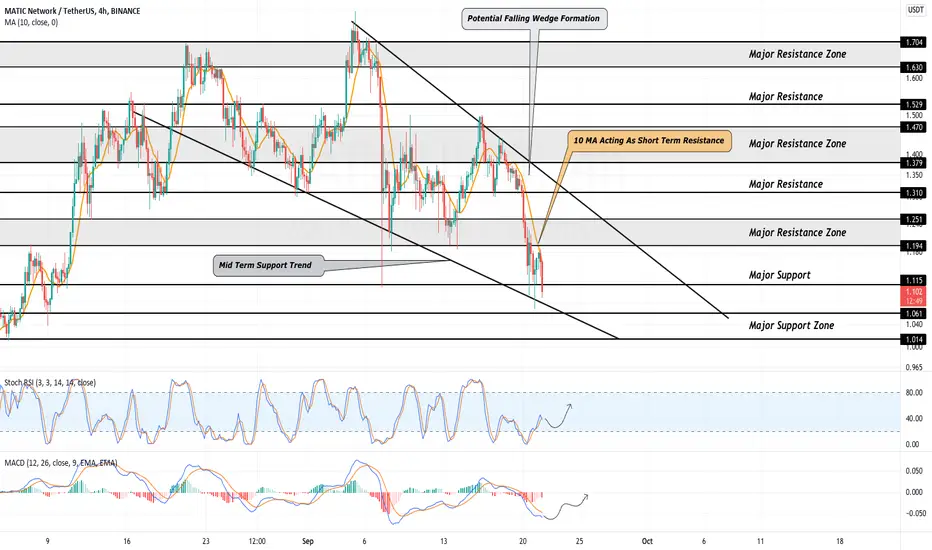
-Price is potentially forming a falling wedge pattern
-MATIC must clear the 10 MA to start a revival
Polygon (MATIC) has been generally quiet over the last few months as focus has turned to NFTs, Solana & Avalanche. Despite the hype mostly dying down around the Matic Network, MATIC token has still been able to hold its spot in the top 30 cryptocurrencies by market cap as it is currently number 22. The overall lackluster price action can be blamed on the fact that MATIC had one of the most explosive bull runs in early 2021. Time is always needed after a large run to gain more steam in hopes of another bullish push.
While looking at the last 45 days of price action, we can see much of the trading took place above the $1.31 level. Just over the last two days, MATIC has broken this level & has fallen to a near 2 month low of around $1.06. Price fell down to a major support level along with a mid term support trend that has bounced price 4 other times. While looking at the down trend (resistance) line formed over the last few weeks, we can see a potential falling wedge formation.
For MATIC to continue the formation of this wedge, price must hold the current support area of $1.06 or it will likely break the mid term support trend line. If this occurs, MATIC will likely drop to $1.00 at minimum. This would be a tremendously bearish situation & would probably land MATIC under the $1.00 mark. In the case bulls manage to hold the current support levels, MATIC will likely bounce back to the major resistance zone found from $1.19-$1.25. This is the area that must break & hold for MATIC to be out of its falling wedge, in a bullish way.
While looking at the Stochastic RSI, we can see after two visits to the oversold region, strength has started rebounding back towards the 50 value. This area is acting as resistance as of now and might cause strength to fall back down for a retest of the 20 value. The MACD has fallen to a 3 week low & is attempting to curl back up. This histogram must tick green along with a bullish cross of the MA’s for MATIC to be in position to revive.
MATIC Intraday Analysis
Spot rate: $1.10
Trend: Bearish
Volatility: Medium
Support: $1.06
Resistance: $1.19
Disclaimer
The information and publications are not meant to be, and do not constitute, financial, investment, trading, or other types of advice or recommendations supplied or endorsed by TradingView. Read more in the Terms of Use.
Disclaimer
The information and publications are not meant to be, and do not constitute, financial, investment, trading, or other types of advice or recommendations supplied or endorsed by TradingView. Read more in the Terms of Use.