MOED Egypt has a potential for a breakout 0.469 / 0.520 / 0.541
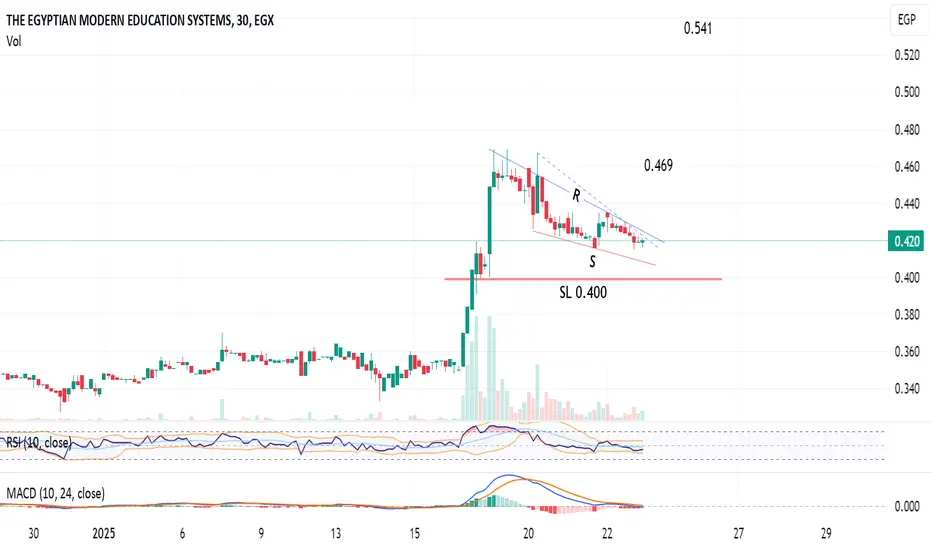
30-min chart
The stock MOED is trading in a falling wedge between R and S lines, and may form a bigger pennant pattern.
We need a confirmation, after closing 3 candles above 0.425, then the target will be 0.469
Above 0.470 for 3 candles, the next target will be 0.520 - extended to 0.541
Consider a near stop loss - and note the important support line at 0.400
The stock
We need a confirmation, after closing 3 candles above 0.425, then the target will be 0.469
Above 0.470 for 3 candles, the next target will be 0.520 - extended to 0.541
Consider a near stop loss - and note the important support line at 0.400
Disclaimer
The information and publications are not meant to be, and do not constitute, financial, investment, trading, or other types of advice or recommendations supplied or endorsed by TradingView. Read more in the Terms of Use.
Disclaimer
The information and publications are not meant to be, and do not constitute, financial, investment, trading, or other types of advice or recommendations supplied or endorsed by TradingView. Read more in the Terms of Use.