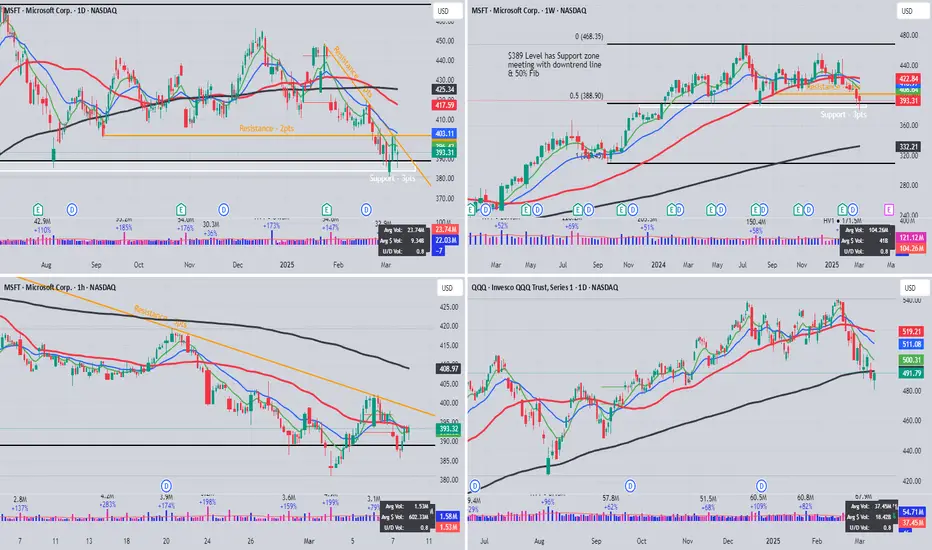
MSFT Charts showing confluence at the $389 level. There are support & resistance lines meeting with 50% Fib.
Volume is higher at trendline touches but not extreme.
Volume is higher at trendline touches but not extreme.
Disclaimer
The information and publications are not meant to be, and do not constitute, financial, investment, trading, or other types of advice or recommendations supplied or endorsed by TradingView. Read more in the Terms of Use.
Disclaimer
The information and publications are not meant to be, and do not constitute, financial, investment, trading, or other types of advice or recommendations supplied or endorsed by TradingView. Read more in the Terms of Use.