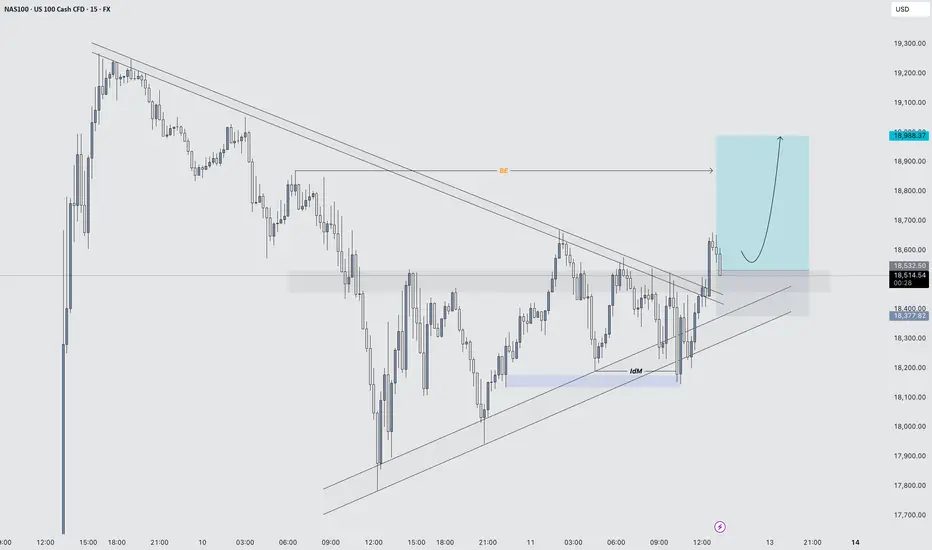
1. Symmetrical Triangle Formation
Price was compressing inside a symmetrical triangle, with a series of lower highs and higher lows, indicating indecision and buildup of pressure.
2. Downside Fake-out (False Breakout)
Price briefly broke below the lower trendline, suggesting a potential bearish breakout.
However, there was no strong follow-through; instead, price quickly reclaimed the trendline and pushed back inside the structure.
This is a classic fake-out, often trapping late sellers and providing liquidity for buyers.
The rejection from the lows resulted in a long wick, signalling strong buying interest and failure to break down.
3. Aggressive Bullish Reaction
After reclaiming the triangle support, price moved rapidly back to the top of the triangle.
The next key move was a strong breakout above the upper trendline, confirming bullish intent.
4. Break and Retest
Price action followed through with a clean breakout above resistance, followed by a minor pullback and retest of the broken trendline, which held as support.
This retest offered a textbook entry point based on price action principles.
5. Bullish Structure Confirmation
Post breakout, price formed a higher low and continued to make a higher high, confirming a trend shift.
This structural change strengthens the bullish outlook.
Trade closed: target reached
Disclaimer
The information and publications are not meant to be, and do not constitute, financial, investment, trading, or other types of advice or recommendations supplied or endorsed by TradingView. Read more in the Terms of Use.
Disclaimer
The information and publications are not meant to be, and do not constitute, financial, investment, trading, or other types of advice or recommendations supplied or endorsed by TradingView. Read more in the Terms of Use.