I trade Nasdaq intraday exclusively
Trading in GMT time zone
Sharing my post day review & analysis in case it can help you :)
Did my analysis at +- 5:20am GMT
Looking exclusively for a buy, as Nasdaq is bullish overall – “The trend is your friend”
Even though we are at all-time highs, I keep my bias bullish.
At time of analysis, I noted the following:
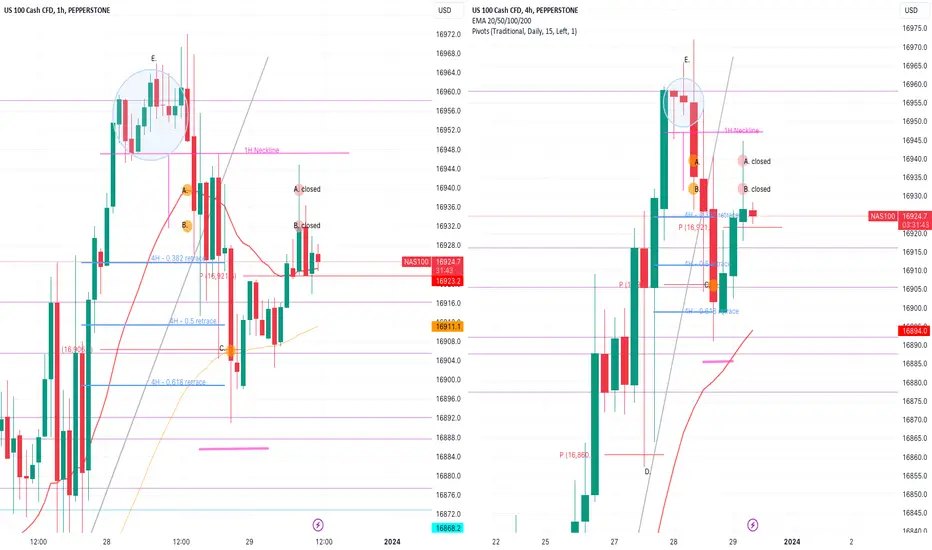
Early morning market had pushed up and by the time I was doing my analysis, price was consolidating in the blue circle.
At 7am GMT, the 4H candle closed a red hanging man candle, warning of a potential bearish push.
On the 1H TF, a double top market pattern started to develop. Neckline and potential move down (i.e. the same distance as the height of the pattern) if neckline was broken indicated with pink lines.
My morning fib was drawn from swing low at D. to swing high at E. and retracement levels written in blue.
I was cautious of a bearish pushdown and so entered half positions to see how price reacted.
Also noted that fib levels were relatively close together meaning that potential draw down / loss would be manageable.
Entered half a position buy at A. and then a few minutes later half a position at B. – Confirmations:
S&R: 1H 20EMA dynamic support. On the 5min TF, a doji candle formed at this level indicating that perhaps the EMA would provide support. But 5min TF is not very strong and this was weak confirmation – hence half a position.
Trendline: Market was near the bottom uptrend line of ascending wedge on the D TF. This trend line had been respected multiple times before.
Fib: none (kinda close to 0.382 level so these positions represented my aggressive shallow retracement entries)
Candle stick: there was a long wick green candlestick rejecting this level that formed on the 30min TF, that closed above the 1H neckline, indicating strength of buyers.
Market pattern: Usually market moves the same distance down as the height of the double top. And I like being part of the re-test of the neckline that is in the same direction as the overall trend.
Mental stop was placed below the 0.618 fib level where the 4H EMA would also have provided a bullish push up. If candles started closing past this point, then my buy would be invalidated.
Ultimately, buyers were unable to break through the 1H double top neckline and bears stepped in to create a big retracement move.
I entered a full buy position at C. – Confirmations:
S&R: pivot point
Trendline: Ascending wedge trendline had been broken bearish, so this could potentially be a breakout from the wedge and could lead to a massive bearish move. So extra risky here. But I had confidence that market would at least re-test this trendline.
Fib: C. represented a level between the 0.50 and 0.618 fib level. This was my last position and I would not have entered again at the 0.618 level. I preferred to take a draw down if market continued to move down. What makes trading Nasdaq so hard is the extreme volatility and long candles spikes. We saw just yesterday how market only touched the pivot point and then flew up.
Candle stick: Before I entered at C. there was a long wick candle that touched the pivot and closed above the 0.382 fib level, giving me confidence that buyers were rejecting this level.
Market pattern: none
So now I was in a risky position with 2 buy positions in a market that was temporarily bearish.
I knew that I wanted to close my A. and B. positions as soon as market moved up so I set a take profit at entry for both.
Going to sleep with 2 buy positions and a red day candle close was stressful.
But luckily market has moved up the next day and my positions automatically closed at entry and now I am left with my C. position.
In these types of situations you must control greed, because on the 1H TF where the red dots are marked, you can imagine that the 1H candle was fully green at a point in time (where it is now a spike) and you see the momentum with which the candle is moving, so thoughts come into your mind like “imagine market continues to move up and then I have 2 buys open – Cha CHING!!! Let me remove my automatic take profits”. But the bottom line is that it will take a big bullish push to break that neckline and market can easily turn down again (ascending wedge trendline was broken bearish after all). So one has to consider rationally how much risk you are willing to take and not act in greed.
My C. position is now secured at entry and I’m hoping for a strong move up!
Good luck if you are trading!
TF = timeframe
TP = take profit
1H = 1 hour
4H = 4 hour
D = day
W = week
M = month
S&R = support and resistance
EMA = exponential moving average
Trading in GMT time zone
Sharing my post day review & analysis in case it can help you :)
Did my analysis at +- 5:20am GMT
Looking exclusively for a buy, as Nasdaq is bullish overall – “The trend is your friend”
Even though we are at all-time highs, I keep my bias bullish.
At time of analysis, I noted the following:
Early morning market had pushed up and by the time I was doing my analysis, price was consolidating in the blue circle.
At 7am GMT, the 4H candle closed a red hanging man candle, warning of a potential bearish push.
On the 1H TF, a double top market pattern started to develop. Neckline and potential move down (i.e. the same distance as the height of the pattern) if neckline was broken indicated with pink lines.
My morning fib was drawn from swing low at D. to swing high at E. and retracement levels written in blue.
I was cautious of a bearish pushdown and so entered half positions to see how price reacted.
Also noted that fib levels were relatively close together meaning that potential draw down / loss would be manageable.
Entered half a position buy at A. and then a few minutes later half a position at B. – Confirmations:
S&R: 1H 20EMA dynamic support. On the 5min TF, a doji candle formed at this level indicating that perhaps the EMA would provide support. But 5min TF is not very strong and this was weak confirmation – hence half a position.
Trendline: Market was near the bottom uptrend line of ascending wedge on the D TF. This trend line had been respected multiple times before.
Fib: none (kinda close to 0.382 level so these positions represented my aggressive shallow retracement entries)
Candle stick: there was a long wick green candlestick rejecting this level that formed on the 30min TF, that closed above the 1H neckline, indicating strength of buyers.
Market pattern: Usually market moves the same distance down as the height of the double top. And I like being part of the re-test of the neckline that is in the same direction as the overall trend.
Mental stop was placed below the 0.618 fib level where the 4H EMA would also have provided a bullish push up. If candles started closing past this point, then my buy would be invalidated.
Ultimately, buyers were unable to break through the 1H double top neckline and bears stepped in to create a big retracement move.
I entered a full buy position at C. – Confirmations:
S&R: pivot point
Trendline: Ascending wedge trendline had been broken bearish, so this could potentially be a breakout from the wedge and could lead to a massive bearish move. So extra risky here. But I had confidence that market would at least re-test this trendline.
Fib: C. represented a level between the 0.50 and 0.618 fib level. This was my last position and I would not have entered again at the 0.618 level. I preferred to take a draw down if market continued to move down. What makes trading Nasdaq so hard is the extreme volatility and long candles spikes. We saw just yesterday how market only touched the pivot point and then flew up.
Candle stick: Before I entered at C. there was a long wick candle that touched the pivot and closed above the 0.382 fib level, giving me confidence that buyers were rejecting this level.
Market pattern: none
So now I was in a risky position with 2 buy positions in a market that was temporarily bearish.
I knew that I wanted to close my A. and B. positions as soon as market moved up so I set a take profit at entry for both.
Going to sleep with 2 buy positions and a red day candle close was stressful.
But luckily market has moved up the next day and my positions automatically closed at entry and now I am left with my C. position.
In these types of situations you must control greed, because on the 1H TF where the red dots are marked, you can imagine that the 1H candle was fully green at a point in time (where it is now a spike) and you see the momentum with which the candle is moving, so thoughts come into your mind like “imagine market continues to move up and then I have 2 buys open – Cha CHING!!! Let me remove my automatic take profits”. But the bottom line is that it will take a big bullish push to break that neckline and market can easily turn down again (ascending wedge trendline was broken bearish after all). So one has to consider rationally how much risk you are willing to take and not act in greed.
My C. position is now secured at entry and I’m hoping for a strong move up!
Good luck if you are trading!
TF = timeframe
TP = take profit
1H = 1 hour
4H = 4 hour
D = day
W = week
M = month
S&R = support and resistance
EMA = exponential moving average
Disclaimer
The information and publications are not meant to be, and do not constitute, financial, investment, trading, or other types of advice or recommendations supplied or endorsed by TradingView. Read more in the Terms of Use.
Disclaimer
The information and publications are not meant to be, and do not constitute, financial, investment, trading, or other types of advice or recommendations supplied or endorsed by TradingView. Read more in the Terms of Use.