I trade Nasdaq intraday exclusively
Trading in GMT time zone
Sharing my post day review & analysis in case it can help you :)
Did my analysis at +- 5:20am GMT.
Looking exclusively for a buy because Nasdaq is bullish at the moment - "The trend is your friend".
As always in a trending market, the market could retrace before continuing the current trend.
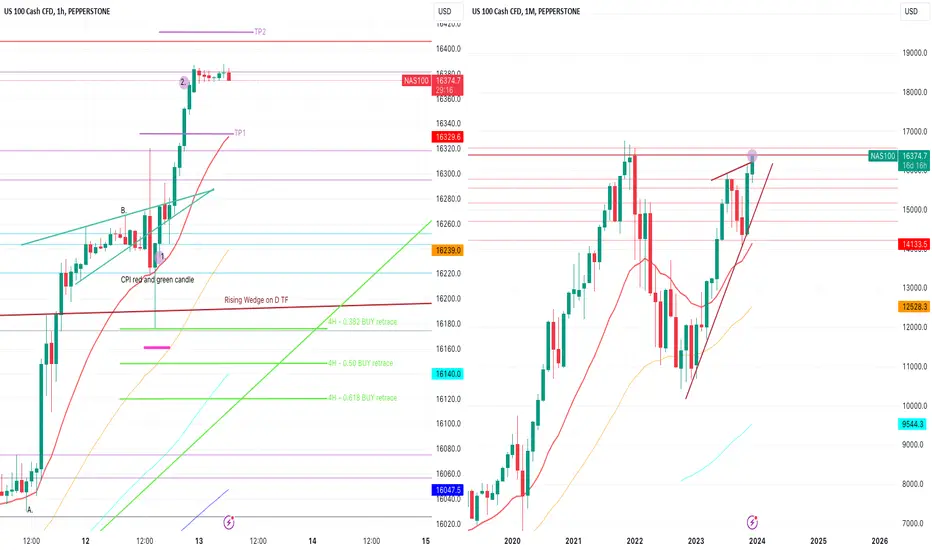
So I drew my Fib from swing low at A. to swing high at B. on the 4H TF - the higher the TF the stronger the fib levels "could" be.
Noted that the market had broken out of the rising wedge which had been forming on the D TF (visible also on the M TF here).
There was no proper re-test of the dark brown line which gave me the feeling that the market still needed to retest this chart pattern.
Yesterday was also CPI news, so I knew it would be a volatile day. I didn't want to get into the market early (before CPI) because this could cause spikes down back into the rising wedge, which if the sellers jumped in, could cause the candles to get sucked deep back into the rising wedge chart pattern.
I also noted that the 4H 20 EMA was far down below and it was a 1300 pip drop to the 0.618 fib level from where the candles were consolidating when I did my analysis. That's a very big draw down that I didn't want to take a chance on.
So I decided to wait for CPI to be released at 13:30pm GMT.
As the morning progressed, noted the formation of a rising wedge (roughly marked with green lines).
CPI caused two long wick candles, one red candle with a long wick up and one green candle with a long wick down - forming a doji on the 4H TF.
I entered a buy at 1. with only one position - confirmations:
1. The CPI green candle reached down to the 0.382 fib retracement level and closed green, above the 1H 20 EMA - indicating that even with news, the dynamic support offered by the 20 EMA was holding strong. So confirmations = Fib level + dynamic support + long wick candlestick formation.
2. Having watched the candles / price action the whole morning, I felt buyers where strong because even the 30min EMA was acting as support until CPI.
Stop loss was a mental stop placed below the 0.382 level at the pivot point. If the candles started closing below this level there would be the serious possibility of the market falling back down into the rising wedge formation.
The market moved up from here and I placed an actual stop loss at entry when the market was +- 250pips from my position.
Watched the candles closely at TP1 to determine if I had to take partial profit but bulls pushed through easily and I held my full position.
Eventually just before my bedtime, I closed 70% of my position at 2. at +- 21:55pm GMT.
So that's +- 1400pips profit for the day.
Leaving the rest to run today.
Today we have FOMC, plus we get to watch what the market does as it approaches the all time high on the M TF.
All the best for your trading! :)
TF = timeframe
TP = take profit
1H = 1 hour
4H = 4 hour
D = day
W = week
M = month
Trading in GMT time zone
Sharing my post day review & analysis in case it can help you :)
Did my analysis at +- 5:20am GMT.
Looking exclusively for a buy because Nasdaq is bullish at the moment - "The trend is your friend".
As always in a trending market, the market could retrace before continuing the current trend.
So I drew my Fib from swing low at A. to swing high at B. on the 4H TF - the higher the TF the stronger the fib levels "could" be.
Noted that the market had broken out of the rising wedge which had been forming on the D TF (visible also on the M TF here).
There was no proper re-test of the dark brown line which gave me the feeling that the market still needed to retest this chart pattern.
Yesterday was also CPI news, so I knew it would be a volatile day. I didn't want to get into the market early (before CPI) because this could cause spikes down back into the rising wedge, which if the sellers jumped in, could cause the candles to get sucked deep back into the rising wedge chart pattern.
I also noted that the 4H 20 EMA was far down below and it was a 1300 pip drop to the 0.618 fib level from where the candles were consolidating when I did my analysis. That's a very big draw down that I didn't want to take a chance on.
So I decided to wait for CPI to be released at 13:30pm GMT.
As the morning progressed, noted the formation of a rising wedge (roughly marked with green lines).
CPI caused two long wick candles, one red candle with a long wick up and one green candle with a long wick down - forming a doji on the 4H TF.
I entered a buy at 1. with only one position - confirmations:
1. The CPI green candle reached down to the 0.382 fib retracement level and closed green, above the 1H 20 EMA - indicating that even with news, the dynamic support offered by the 20 EMA was holding strong. So confirmations = Fib level + dynamic support + long wick candlestick formation.
2. Having watched the candles / price action the whole morning, I felt buyers where strong because even the 30min EMA was acting as support until CPI.
Stop loss was a mental stop placed below the 0.382 level at the pivot point. If the candles started closing below this level there would be the serious possibility of the market falling back down into the rising wedge formation.
The market moved up from here and I placed an actual stop loss at entry when the market was +- 250pips from my position.
Watched the candles closely at TP1 to determine if I had to take partial profit but bulls pushed through easily and I held my full position.
Eventually just before my bedtime, I closed 70% of my position at 2. at +- 21:55pm GMT.
So that's +- 1400pips profit for the day.
Leaving the rest to run today.
Today we have FOMC, plus we get to watch what the market does as it approaches the all time high on the M TF.
All the best for your trading! :)
TF = timeframe
TP = take profit
1H = 1 hour
4H = 4 hour
D = day
W = week
M = month
Disclaimer
The information and publications are not meant to be, and do not constitute, financial, investment, trading, or other types of advice or recommendations supplied or endorsed by TradingView. Read more in the Terms of Use.
Disclaimer
The information and publications are not meant to be, and do not constitute, financial, investment, trading, or other types of advice or recommendations supplied or endorsed by TradingView. Read more in the Terms of Use.