I trade Nasdaq intraday exclusively
Trading in GMT time zone
Sharing my post day review & analysis in case it can help you :)
Did my analysis at +- 5:20am GMT
Looking exclusively for a buy, as Nasdaq is bullish overall – “The trend is your friend”
Even though we are at all-time highs, I keep my bias bullish.
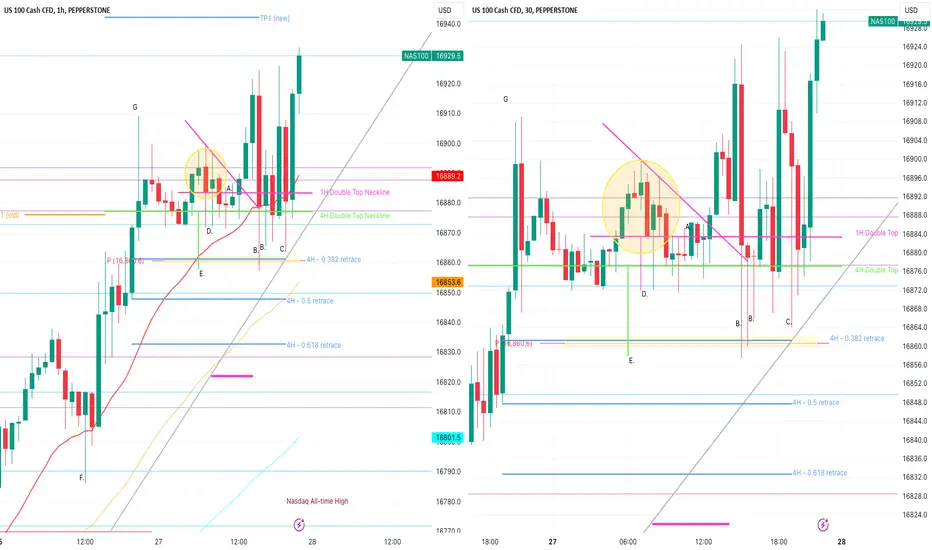
At time of analysis, I noted the following:
4H retracement levels were not far down from where price was consolidating – this means possible drawdowns will hopefully be limited.
1H EMA + pivot point + 4H 0.382 Fib retracement level all converged at one level, making for an excellent potential entry point.
This made the yellow highlighted area one of great interest and where I was hoping to enter the market with a buy.
I wanted a quality entry as I have my runner open from yesterday’s buy and I don’t want to take risk unnecessarily.
As the morning progressed multiple double tops began forming on the 30min, 1H and 4H TF.
If the necklines of these double tops start breaking progressively, this can lead to a very bearish push down, so had to watch the charts carefully.
But bulls prevented price from breaking the 4H double top neckline (marked in green).
I entered a buy at A. – Confirmations:
S&R: Price unable to break down below 4H neckline of double top (strong 4H support)
Candles: Long wick candles forming on the 1H TF, rejecting this strong support level + red doji candle forming on 1H TF just before A.
Fib: bulls seemed not to want the market to make a shallow retracement as price was not able to move lower to the 0.382 fib level
Market pattern: Entered at A. which represented a break of the neckline of a double bottom on the 15min TF and the 30min TF. Market had already moved down to D. which is the same distance as the height of the pattern and then moved up to re-test the neckline. I entered my buy when the neckline was unable to hold the market down.
Mental stop placed at thick pink line which represented a strong area where trendline + 0.618 fib and 4H 20 EMA converged. I would have added another position at this level if market retraced this far.
The plan:
Take profit plan was to close half my position at TP 1 and let the rest run with a time stop i.e. see how the day plays out as often Nasdaq can rally for the whole day.
The Reality:
Endured a bit of a draw down and then market moved up 350 pips from my position. As per usual, I secured my position at entry after the market had moved up +- 250 pips.
Unfortunately, there was a strong bearish push down which took my position out at entry – so my buy at A. was closed.
I entered a buy (half a position at B.) and then another half position at B. when the market came down again – Confirmations:
S&R: Strong pivot point that market had been rejecting the whole day
Candles: First half position at B. there was no candle stick confirmation, but for the second half position at B. there was a long wick candle on the 30min which closed above the green line representing the 4H Double Top Neckline, indicating that sellers were unable to keep the market below this important market pattern level. Buyers were strong, refusing the sellers to close candles below this point.
Fib: This area represented the 4H 0.382 retracement level (fib draw on 4H chart from swing low at F. to swing high at G.
Market pattern: A double top had formed on the 4H TF. The area at E. represented the distance that the market usually moves after breaking the neckline of the double top i.e. market will move down a distance approximately the same as the height of the market pattern. Then there is often a move back to the neckline to retest. I like entering at this level represented by E. because the re-test is in the same direction of the overall trend i.e. bullish in this case.
Mental stop was same as above.
Take profit plan was same as above. As usual, I secured at entry after 250 pips.
Market moved up +-590 pips before spiking down and taking me out at C. before a big move up. This was the move I was waiting for today, but unfortunately, I was not part of the action this time.
What could I have done differently:
I could have monitored the price action at C to determine if I wanted to re-enter, but generally I don’t like to enter the market so late in the trading day, so I would rather be out at entry to live to trade another day, than enter the market at a time that is not per my usual trading style.
So overall, I am happy with my decisions and risk management today even though I didn’t make any profit today. Luckily my runner from the other day is still open and is up over 1000 pips….so didn’t miss out completely.
Good luck if you are still trading! Hope you caught some pips! :)
TF = timeframe
TP = take profit
1H = 1 hour
4H = 4 hour
D = day
W = week
M = month
S&R = support and resistance
EMA = exponential moving average
Trading in GMT time zone
Sharing my post day review & analysis in case it can help you :)
Did my analysis at +- 5:20am GMT
Looking exclusively for a buy, as Nasdaq is bullish overall – “The trend is your friend”
Even though we are at all-time highs, I keep my bias bullish.
At time of analysis, I noted the following:
4H retracement levels were not far down from where price was consolidating – this means possible drawdowns will hopefully be limited.
1H EMA + pivot point + 4H 0.382 Fib retracement level all converged at one level, making for an excellent potential entry point.
This made the yellow highlighted area one of great interest and where I was hoping to enter the market with a buy.
I wanted a quality entry as I have my runner open from yesterday’s buy and I don’t want to take risk unnecessarily.
As the morning progressed multiple double tops began forming on the 30min, 1H and 4H TF.
If the necklines of these double tops start breaking progressively, this can lead to a very bearish push down, so had to watch the charts carefully.
But bulls prevented price from breaking the 4H double top neckline (marked in green).
I entered a buy at A. – Confirmations:
S&R: Price unable to break down below 4H neckline of double top (strong 4H support)
Candles: Long wick candles forming on the 1H TF, rejecting this strong support level + red doji candle forming on 1H TF just before A.
Fib: bulls seemed not to want the market to make a shallow retracement as price was not able to move lower to the 0.382 fib level
Market pattern: Entered at A. which represented a break of the neckline of a double bottom on the 15min TF and the 30min TF. Market had already moved down to D. which is the same distance as the height of the pattern and then moved up to re-test the neckline. I entered my buy when the neckline was unable to hold the market down.
Mental stop placed at thick pink line which represented a strong area where trendline + 0.618 fib and 4H 20 EMA converged. I would have added another position at this level if market retraced this far.
The plan:
Take profit plan was to close half my position at TP 1 and let the rest run with a time stop i.e. see how the day plays out as often Nasdaq can rally for the whole day.
The Reality:
Endured a bit of a draw down and then market moved up 350 pips from my position. As per usual, I secured my position at entry after the market had moved up +- 250 pips.
Unfortunately, there was a strong bearish push down which took my position out at entry – so my buy at A. was closed.
I entered a buy (half a position at B.) and then another half position at B. when the market came down again – Confirmations:
S&R: Strong pivot point that market had been rejecting the whole day
Candles: First half position at B. there was no candle stick confirmation, but for the second half position at B. there was a long wick candle on the 30min which closed above the green line representing the 4H Double Top Neckline, indicating that sellers were unable to keep the market below this important market pattern level. Buyers were strong, refusing the sellers to close candles below this point.
Fib: This area represented the 4H 0.382 retracement level (fib draw on 4H chart from swing low at F. to swing high at G.
Market pattern: A double top had formed on the 4H TF. The area at E. represented the distance that the market usually moves after breaking the neckline of the double top i.e. market will move down a distance approximately the same as the height of the market pattern. Then there is often a move back to the neckline to retest. I like entering at this level represented by E. because the re-test is in the same direction of the overall trend i.e. bullish in this case.
Mental stop was same as above.
Take profit plan was same as above. As usual, I secured at entry after 250 pips.
Market moved up +-590 pips before spiking down and taking me out at C. before a big move up. This was the move I was waiting for today, but unfortunately, I was not part of the action this time.
What could I have done differently:
I could have monitored the price action at C to determine if I wanted to re-enter, but generally I don’t like to enter the market so late in the trading day, so I would rather be out at entry to live to trade another day, than enter the market at a time that is not per my usual trading style.
So overall, I am happy with my decisions and risk management today even though I didn’t make any profit today. Luckily my runner from the other day is still open and is up over 1000 pips….so didn’t miss out completely.
Good luck if you are still trading! Hope you caught some pips! :)
TF = timeframe
TP = take profit
1H = 1 hour
4H = 4 hour
D = day
W = week
M = month
S&R = support and resistance
EMA = exponential moving average
Disclaimer
The information and publications are not meant to be, and do not constitute, financial, investment, trading, or other types of advice or recommendations supplied or endorsed by TradingView. Read more in the Terms of Use.
Disclaimer
The information and publications are not meant to be, and do not constitute, financial, investment, trading, or other types of advice or recommendations supplied or endorsed by TradingView. Read more in the Terms of Use.