I trade Nasdaq intraday exclusively
Trading in GMT time zone
Sharing my post day review & analysis in case it can help you :)
Did my analysis at +- 5:20am GMT
Looking exclusively for a buy, as Nasdaq is bullish overall – “The trend is your friend”
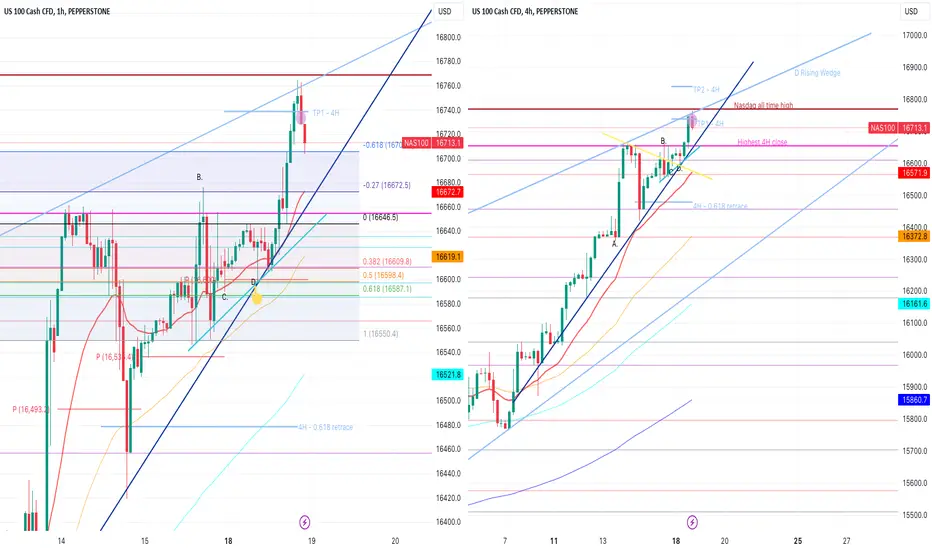
Navy blue trend line indicating just how steep and bullish the current trend is.
At the time of my analysis, noted the following:
In the early morning hours, the market had tested the pivot point and the 1H EMA at C. resulting in a long wick candle – showing buyers rejecting this area.
From there, market moved up steadily towards the pink resistance line.
This pink line has been rejected on multiple occasions on the 4H TF. This resistance represents the highest ever 4H candle close in Nasdaq history, so it’s a significant resistance zone.
Even though we had a deep retracement at A. previously, the market (bullish trend) + pivot points + EMA's are moving closer and closer to this line, even after multiple rejections. So bulls keep pushing up to this area.
The early morning bulls had broken the yellow temporary trend line, by the green 4H candle close at C.
So for me, with pivots and EMA’s below the candles and the temporary yellow down trend broken, market was ready to test the pink resistance line again today. It seemed that the fib drawn previously (the other day) from swing low at A. to swing high at B, was still in play. I was ready for a buy.
Bears pushed down heavily at +- 8:30am GMT, pushed through the 1H EMA, down to the pivot.
I entered a buy at the bottom of the wick at D. (the stars aligned, and it was a perfect buy) – Confirmations:
- S&R: Pivot point
- Trend line: Navy blue trend line
- Fib level: 0.50 fib level on the short term Fib on 1H (drawn in)
Super aggressive entry, where candles could easily have fallen through. But I have seen with Nasdaq that sometimes the market will push to the very tipping point and then move significantly from there. Sometimes that tipping point is not clear. But today it was clear (to me at least) that if Nasdaq closes down past the pivot point (which was below the 1H EMA) that a big retracement would take place.
Entering at this very tipping point between buy and sell can sometimes be a good strategy (and one that I must test more) because your stop loss is so close to your entry, that you don’t stand to lose much. If the candles start closing below the pivot point and the bulls are not strong enough to even bounce from this zone, then the buy is invalid and you cut your small losses quickly. But often, at this tipping point, you get a big reaction, and this is what happened today.
Once the market moved up +-250 pips, I put stop loss at entry and I was trading risk free for the day.
Ultimately, New York market open was strong enough to close a 4H candle above the pink resistance line (the highest ever 4H candle close).
With bulls strong enough to achieve this, I knew Nasdaq was in new territory and was willing to go big or go home with nothing (i.e I would not take profit until market rallied - I would rather be taken out at entry). Market retested the pink line with a red candle on the 1H and moved up from there.
In terms of taking profit, I wanted to see how far bulls could rally and waited for the first red candle to close on the 1H TF before closing for the day (at purple dot).
Market ran +- 1650 pips from my entry and I closed at +- 1300 pips profit for the day (at purple dot).
What would I have done differently:
Enter a bigger position at my entry today. So easy to say in hindsight, isn't it! :) But I need to do some serious back testing on my "tipping point" theory - so that's my take away for today.
We are now close to Nasdaq all time high – exciting times! :)
Good luck if you are still trading – hope you caught the buy! :)
TF = timeframe
TP = take profit
1H = 1 hour
4H = 4 hour
D = day
W = week
M = month
S&R = support and resistance
EMA = exponential moving average
Trading in GMT time zone
Sharing my post day review & analysis in case it can help you :)
Did my analysis at +- 5:20am GMT
Looking exclusively for a buy, as Nasdaq is bullish overall – “The trend is your friend”
Navy blue trend line indicating just how steep and bullish the current trend is.
At the time of my analysis, noted the following:
In the early morning hours, the market had tested the pivot point and the 1H EMA at C. resulting in a long wick candle – showing buyers rejecting this area.
From there, market moved up steadily towards the pink resistance line.
This pink line has been rejected on multiple occasions on the 4H TF. This resistance represents the highest ever 4H candle close in Nasdaq history, so it’s a significant resistance zone.
Even though we had a deep retracement at A. previously, the market (bullish trend) + pivot points + EMA's are moving closer and closer to this line, even after multiple rejections. So bulls keep pushing up to this area.
The early morning bulls had broken the yellow temporary trend line, by the green 4H candle close at C.
So for me, with pivots and EMA’s below the candles and the temporary yellow down trend broken, market was ready to test the pink resistance line again today. It seemed that the fib drawn previously (the other day) from swing low at A. to swing high at B, was still in play. I was ready for a buy.
Bears pushed down heavily at +- 8:30am GMT, pushed through the 1H EMA, down to the pivot.
I entered a buy at the bottom of the wick at D. (the stars aligned, and it was a perfect buy) – Confirmations:
- S&R: Pivot point
- Trend line: Navy blue trend line
- Fib level: 0.50 fib level on the short term Fib on 1H (drawn in)
Super aggressive entry, where candles could easily have fallen through. But I have seen with Nasdaq that sometimes the market will push to the very tipping point and then move significantly from there. Sometimes that tipping point is not clear. But today it was clear (to me at least) that if Nasdaq closes down past the pivot point (which was below the 1H EMA) that a big retracement would take place.
Entering at this very tipping point between buy and sell can sometimes be a good strategy (and one that I must test more) because your stop loss is so close to your entry, that you don’t stand to lose much. If the candles start closing below the pivot point and the bulls are not strong enough to even bounce from this zone, then the buy is invalid and you cut your small losses quickly. But often, at this tipping point, you get a big reaction, and this is what happened today.
Once the market moved up +-250 pips, I put stop loss at entry and I was trading risk free for the day.
Ultimately, New York market open was strong enough to close a 4H candle above the pink resistance line (the highest ever 4H candle close).
With bulls strong enough to achieve this, I knew Nasdaq was in new territory and was willing to go big or go home with nothing (i.e I would not take profit until market rallied - I would rather be taken out at entry). Market retested the pink line with a red candle on the 1H and moved up from there.
In terms of taking profit, I wanted to see how far bulls could rally and waited for the first red candle to close on the 1H TF before closing for the day (at purple dot).
Market ran +- 1650 pips from my entry and I closed at +- 1300 pips profit for the day (at purple dot).
What would I have done differently:
Enter a bigger position at my entry today. So easy to say in hindsight, isn't it! :) But I need to do some serious back testing on my "tipping point" theory - so that's my take away for today.
We are now close to Nasdaq all time high – exciting times! :)
Good luck if you are still trading – hope you caught the buy! :)
TF = timeframe
TP = take profit
1H = 1 hour
4H = 4 hour
D = day
W = week
M = month
S&R = support and resistance
EMA = exponential moving average
Disclaimer
The information and publications are not meant to be, and do not constitute, financial, investment, trading, or other types of advice or recommendations supplied or endorsed by TradingView. Read more in the Terms of Use.
Disclaimer
The information and publications are not meant to be, and do not constitute, financial, investment, trading, or other types of advice or recommendations supplied or endorsed by TradingView. Read more in the Terms of Use.