Back in October 2023, NEAR embarked on an incredible bull run lasting 147 days, surging from a low of $0.971 to a high of $9.01—an astounding +828% gain. Following this euphoric phase, the market sentiment shifted dramatically. Over the subsequent 392 days, NEAR retraced to around $2, marking a -78% decline. Now, with the market at a critical juncture, the question remains: when does the madness of the crash end, and can we finally see a reversal?
Harmonic Patterns & Fibonacci Confluence
Chart Pattern Analysis: The XABCD Framework
Using the XABCD pattern tool, we identify the following key points:
Durations:
These durations show remarkable symmetry—with the up-move phases (X-A and A-B) nearly matching in time, and similarly for the correction phases (B-C and C-D). This time symmetry supports the presence of a harmonic structure, and the retracement levels help validate the potential for a reversal.
Fibonacci Implications
While Point D’s retracement at 0.875 is slightly deeper than the classic 0.786 level expected for a Gartley Harmonic, it remains close enough to validate a harmonic correction, especially considering market noise. Additionally, the expansion of BC at 1.212 is close to the 1.27 range, lending further credence to this being a Gartley-type pattern.
Time Factor: Fibonacci Time Extensions & Exhaustion
Fibonacci Time Extensions:
The alignment of these time-based measures with the price retracement (approximately 87.5% retracement of the original move) signals a critical juncture where the bearish phase could soon be over.
Identifying the Support Zone & Long Opportunity
Based on harmonic and Fibonacci analyses, the confluence of key support levels points to a potential bottom:
These levels create a long opportunity window between $1.99 and $1.887. This confluence offers a solid entry region for long positions.
Additionally, other confluence factors include:
High-Probability Trade Setup
Long Entry:
Market Outlook:
Key Takeaways
After decades in the trading arena, one thing is clear—the market often cycles through periods of euphoria and despair before turning a corner. NEAR's confluence of harmonic symmetry, Fibonacci retracement, and time-based exhaustion is almost too aligned to ignore. With a defined long entry window between $1.99 and $1.887, this might be the moment to consider a high-probability long trade. As always, manage your risk diligently and wait for clear confirmation.
Wrapping it up here, happy trading =)
If you found this helpful, leave a like and comment below! Got requests for the next technical analysis? Let me know.
Harmonic Patterns & Fibonacci Confluence
Chart Pattern Analysis: The XABCD Framework
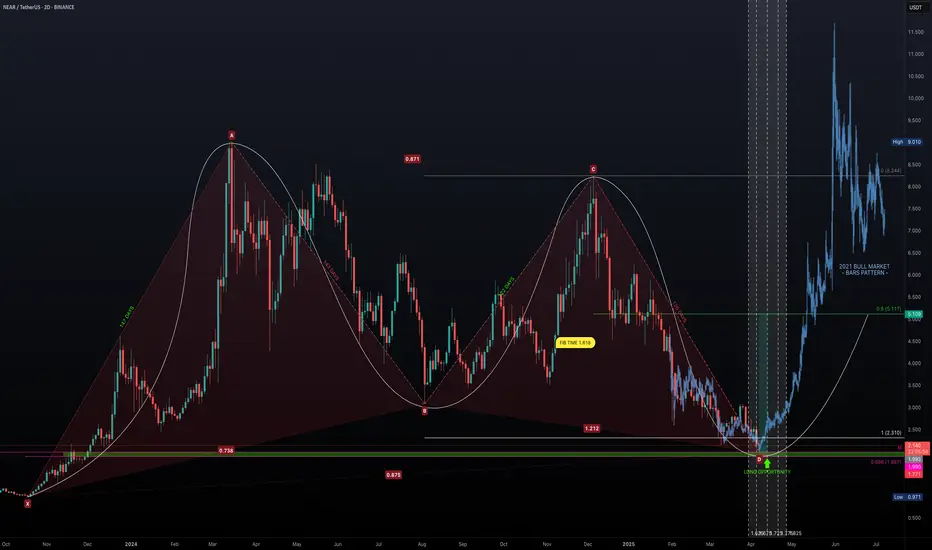
Using the XABCD pattern tool, we identify the following key points:
- Point X: $0.971
- Point A: $9.01
- Point B: $3.076
- Point C: $8.244
- Point D: $1.978
Durations:
- X-A: 147 Days
- A-B: 143 Days
- B-C: 122 Days
- C-D: 126 Days
These durations show remarkable symmetry—with the up-move phases (X-A and A-B) nearly matching in time, and similarly for the correction phases (B-C and C-D). This time symmetry supports the presence of a harmonic structure, and the retracement levels help validate the potential for a reversal.
Fibonacci Implications
- Fib Retracement of XA: Point B is at 0.738
- Fib Retracement of AB: Point C sits at 0.871
- Fib Retracement of BC: Point D lands at 0.875
- Fib Extension of BC: Point D is at 1.212
While Point D’s retracement at 0.875 is slightly deeper than the classic 0.786 level expected for a Gartley Harmonic, it remains close enough to validate a harmonic correction, especially considering market noise. Additionally, the expansion of BC at 1.212 is close to the 1.27 range, lending further credence to this being a Gartley-type pattern.
Time Factor: Fibonacci Time Extensions & Exhaustion
- 147-day Bull Run: NEAR rose from $0.971 to $9.01 in 147 days.
- 392-day Bearish Correction: Since hitting $9.01, the price has retraced for 392 days.
Fibonacci Time Extensions:
- 1.618 multiplier: 147 × 1.618 ≈ 238 days. A Classic "golden ratio" reversal target. This period coincided with a +135% surge in November.
- 2.618 multiplier: 147 × 2.618 ≈ 385 days. High-probability exhaustion point. This is nearly equal to the current 392 days, suggesting that time-based exhaustion may be imminent.
The alignment of these time-based measures with the price retracement (approximately 87.5% retracement of the original move) signals a critical juncture where the bearish phase could soon be over.
Identifying the Support Zone & Long Opportunity
Based on harmonic and Fibonacci analyses, the confluence of key support levels points to a potential bottom:
- Harmonic Point D: Trading near $2.
- Monthly Level: $1.99 acts as a strong support benchmark.
- Fibonacci Retracement (0.886): at $1.887.
These levels create a long opportunity window between $1.99 and $1.887. This confluence offers a solid entry region for long positions.
Additionally, other confluence factors include:
- Fibonacci time extension at the 2.618 level (around 385 days) aligning with the current duration of the bearish phase.
- The symmetry of the XABCD pattern adds to the reliability of the support structure.
High-Probability Trade Setup
Long Entry:
- Entry Zone: Accumulate positions in the $1.99 to $1.887 range.
- Target: Aim for the 0.5 Fibonacci retracement level of the bull run, approximately $5.00, which represents a potential +150% gain from current levels.
- Risk-to-Reward (R:R): With the setup targeting a substantial rebound, the risk-reward ratio is very attractive, particularly if entry is taken in the defined confluence zone.
Market Outlook:
- Current Sentiment: NEAR is in a significant downtrend, evidenced by a dramatic -78% retracement after an explosive bull run.
- Reversal Indicators: The harmonic pattern, Fibonacci retracements, and time exhaustion (392 days approaching the 2.618 extension) all point towards a possible bottom formation in the coming month, particularly during April.
- Potential Reversal: If NEAR holds within the $1.99 to $1.887 window, a reversal back towards $5.00 appears plausible, echoing the conditions seen at previous market cycle reversals.
Key Takeaways
- Historic Run & Severe Correction: NEAR surged over +828% in 147 days only to retrace -78% over the following 392 days.
- Harmonic Confluence: The XABCD pattern and Fibonacci levels create a compelling argument for a turnaround.
- Time & Price Alignment: Fibonacci time extension around 385 days combined with an 87.5% price retracement suggests market exhaustion.
- Solid Long Entry Zone: The support between $1.99 and $1.887 offers an attractive risk entry point with the potential to target a move back up to $5.00.
After decades in the trading arena, one thing is clear—the market often cycles through periods of euphoria and despair before turning a corner. NEAR's confluence of harmonic symmetry, Fibonacci retracement, and time-based exhaustion is almost too aligned to ignore. With a defined long entry window between $1.99 and $1.887, this might be the moment to consider a high-probability long trade. As always, manage your risk diligently and wait for clear confirmation.
Wrapping it up here, happy trading =)
If you found this helpful, leave a like and comment below! Got requests for the next technical analysis? Let me know.
Trade active
NEAR continues to show signs of strength after reaching the 0.886 Fibonacci retracement level at $1.887, marking a completion of a 5-wave corrective structure. Following this deep retracement, we’ve seen a notable spike in volume, suggesting that accumulation is underway, especially as price moved back toward a key previous high.
📌 Possible Inverse Head & Shoulders in Formation
What makes this setup even more compelling is the emerging inverse head and shoulders pattern:
Left Shoulder: Volume spike at $2, aligning with the monthly support level—this area served as the initial base of demand.
Head: Defined at the low of $1.821, aligning with the 0.886 Fib—a deep but common reversal zone in harmonic structures.
Right Shoulder: Currently in progress, with price consolidating near the $2 support zone.
🔍 Trade Setup Details
This structure opens up a high-probability long opportunity:
Entry Zone: Between $2.00 and $1.90, ideal for laddering entries while the right shoulder forms.
Stop Loss: Just below the head, at $1.82—logical invalidation level.
Neckline Resistance: $2.15 – A decisive break and retest of this level would validate the inverse H&S and confirm trend reversal.
🎯 Price Targets (Using Fibonacci Retracement from $3.093 to $1.821)
TP1 – $2.30: 0.382 Fibonacci retracement – aligns with the anchored VWAP from the $3.093 high, creating a significant resistance.
TP2 – $2.60: 0.618 retracement – a classic reversal target for corrective bounces and potential mid-term top.
📊 Risk-to-Reward Breakdown
Target 1 (TP1 – $2.30): R:R ≈ 2.5:1
Target 2 (TP2 – $2.60): R:R ≈ 4.5:1
These are excellent risk-reward ratios, especially considering the potential confirmation from the pattern's neckline breakout.
💡 Optional Trade Idea
More conservative traders may choose to wait for confirmation of the pattern by entering after a breakout and retest of the $2.15 neckline, aiming for the same upside targets with added confidence, albeit with a slightly different entry point and adjusted stop loss.
This setup checks all the boxes:
High-volume reaction from a fib-rich reversal zone.
Classic reversal pattern forming.
Clear support and resistance levels defined by price action and volume.
Optional entry strategies depending on risk tolerance and trading style.
🏆 Mastering Fibonacci for precision trading
🔹 Sharing high-probability trade setups
⚡ Unlock the power of technical analysis!
🔹 Sharing high-probability trade setups
⚡ Unlock the power of technical analysis!
Related publications
Disclaimer
The information and publications are not meant to be, and do not constitute, financial, investment, trading, or other types of advice or recommendations supplied or endorsed by TradingView. Read more in the Terms of Use.