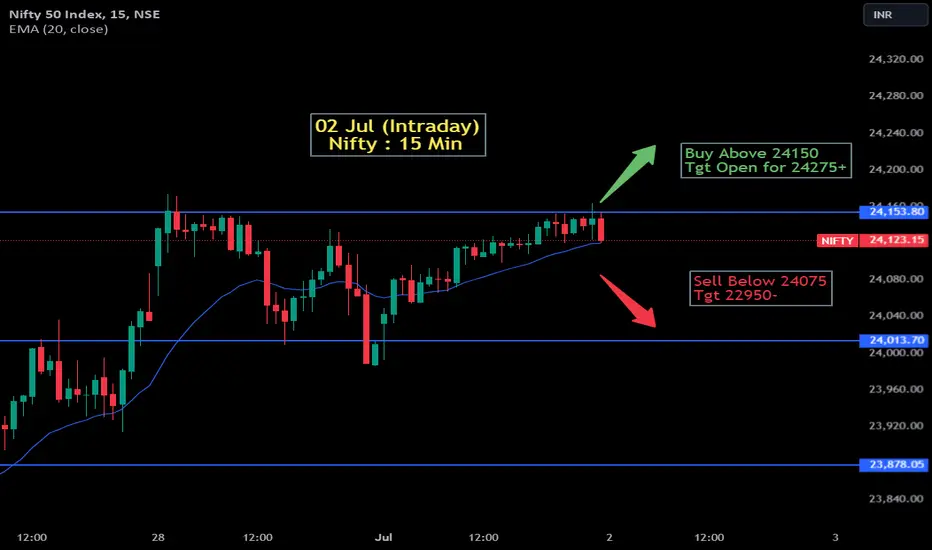
An intraday trading chart for the Nifty 50 Index on July 2, 2024, captured in 15-minute intervals. Here's a detailed overview of the chart:
Candlestick Format: Utilizes candlestick bars to depict price action for each 15-minute period, indicating open, high, low, and close prices.
Exponential Moving Average (EMA): A blue line representing the 20-period EMA is visible, which helps traders identify the trend's direction and dynamic levels of support or resistance.
Trading Signals:
-Buy Signal: A green arrow points upwards, suggesting to buy if the Nifty exceeds 24,150, with an open target potentially reaching or surpassing 24,275.
-Sell Signal: A red arrow pointing downwards indicates a selling opportunity if the index falls below 24,075, with a target of 22,950.
Technical Analysis Overview: The chart illustrates the Nifty's price movements within a sideways to an upward trend, using the EMA line as a reference point for potential support or resistance levels. The annotations provide strategic entry and exit points based on specific price thresholds.
Disclaimer
The information and publications are not meant to be, and do not constitute, financial, investment, trading, or other types of advice or recommendations supplied or endorsed by TradingView. Read more in the Terms of Use.
Disclaimer
The information and publications are not meant to be, and do not constitute, financial, investment, trading, or other types of advice or recommendations supplied or endorsed by TradingView. Read more in the Terms of Use.