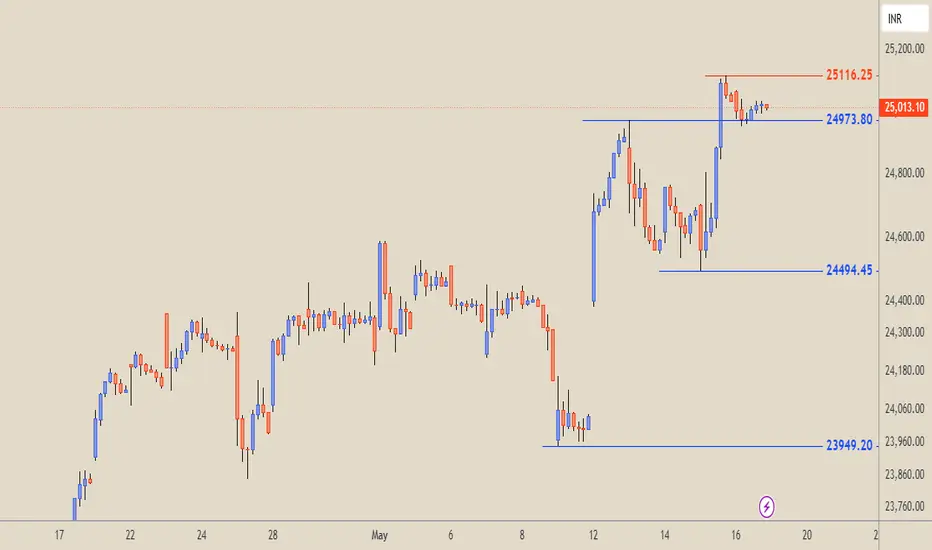
📊 Key Levels:
Support Levels (Blue Lines):
₹24,973.80 → Nearest immediate support
₹24,494.45 → Intermediate support
₹23,949.20 → Strong lower support / Demand zone
Resistance Levels (Red Lines):
₹25,116.25 → Immediate resistance (near consolidation zone)
₹26,277.35 → Major resistance (previous swing high)
🔄 Trend & Price Action:
Recent Trend: Strong bullish rally from the low near ₹23,949.20 to above ₹25,000.
Current Phase: Price is consolidating right below the ₹25,116.25 resistance after a strong bullish impulse (potential bullish flag or continuation pattern).
📌 Technical Insights:
✅ Bullish Signals:
Price made a higher low at ₹23,949.20, followed by a higher high.
Clear impulsive structure from May 13–16.
Consolidation just below resistance hints at potential breakout continuation.
Support level at ₹24,973.80 is holding price above.
⚠️ Bearish Risks:
Failure to break above ₹25,116.25 may lead to a retest of ₹24,494.45.
If price drops below ₹24,494.45, it may test the demand zone near ₹23,949.20.
Overhead resistance at ₹26,277.35 and long-term barrier at ₹25,791.70 can cap upside if breakout occurs.
🔔 Trading Implications:
Bullish Bias: On breakout above ₹25,116.25 with target towards ₹25,791.70 and ₹26,277.35.
Bearish Scenario: Breakdown below ₹24,973.80 can target ₹24,494.45 and ₹23,949.20.
Disclaimer
The information and publications are not meant to be, and do not constitute, financial, investment, trading, or other types of advice or recommendations supplied or endorsed by TradingView. Read more in the Terms of Use.
Disclaimer
The information and publications are not meant to be, and do not constitute, financial, investment, trading, or other types of advice or recommendations supplied or endorsed by TradingView. Read more in the Terms of Use.