Presuming Nifty Top has been made
Updated

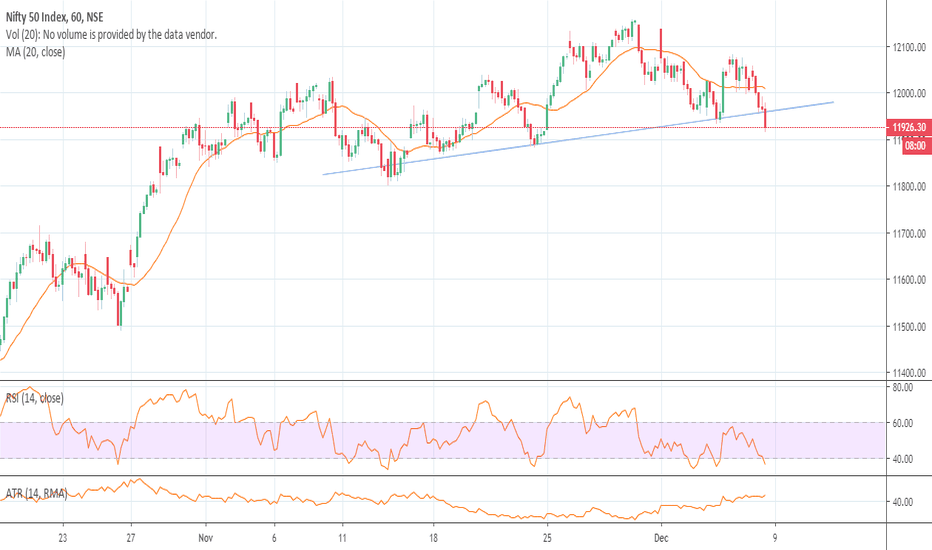
I presume Nifty has made a top at 12158.80 for now
In my earlier post (link attached), I mentioned Nifty making a head and shoulder pattern on the hourly chart which mentions a TGT of 11750-11700.
Nifty Hourly Chart

Now, If you look at daily chart of nifty it has already made a left shoulder and a head, presuming nifty goes down , takes support around 11750 -11 800 levels for a while (previous swing low and 50 DMA)and bounces back to 11950 - 12050 levels ( around the height of the left shoulder) and retraces to 11700(which is the target according to the hourly head and shoulder pattern), it would have then made the Right shoulder on the daily chart as well completing the head and shoulder on the daily chart.
Target of this daily head and shoulder breakdown would come around 11500 - 11450.
Disclamer: It still has a lot of assumptions.
This is analysis only and not a tip to trade.
In my earlier post (link attached), I mentioned Nifty making a head and shoulder pattern on the hourly chart which mentions a TGT of 11750-11700.
Nifty Hourly Chart

Now, If you look at daily chart of nifty it has already made a left shoulder and a head, presuming nifty goes down , takes support around 11750 -11 800 levels for a while (previous swing low and 50 DMA)and bounces back to 11950 - 12050 levels ( around the height of the left shoulder) and retraces to 11700(which is the target according to the hourly head and shoulder pattern), it would have then made the Right shoulder on the daily chart as well completing the head and shoulder on the daily chart.
Target of this daily head and shoulder breakdown would come around 11500 - 11450.
Disclamer: It still has a lot of assumptions.
This is analysis only and not a tip to trade.
Note
Let us see if this bounce makes a right shoulder or takes the Head off ..... ;)Note
Closing of today will be critical ... It will decide the further move ahead for NIFTYTrade closed: stop reached
SL reached stopped out ... head taken offRelated publications
Disclaimer
The information and publications are not meant to be, and do not constitute, financial, investment, trading, or other types of advice or recommendations supplied or endorsed by TradingView. Read more in the Terms of Use.