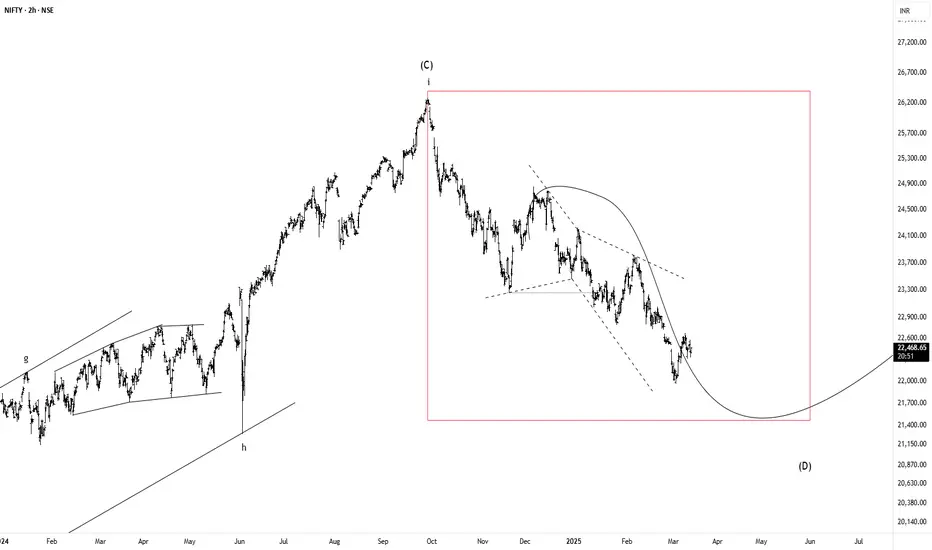
On the 2H timeframe, the recent price correction appears to be a diametric one. When a Diametric Zigzag forms, it usually forms a combination pattern, so we consider 2 scenarios:
Scenario 1
Diametric wave-(g) ends in the range of 21050 – 21473 or even higher and the upward movement begins
Scenario 2
a- Wave-(g) continues to the range of 21050 – 21473 and then, in order to complete the time correction, a combination pattern of Diametric – X – Triangle is formed on the support range.
b- Wave-(g) continues to the range of 21050 – 21473 and then a small X wave is formed, but the price crosses the support range of 21050 – 21473, in this case, the combination pattern will still form, but the price can decrease to 19993 or the price range of 18993-18744 according to the second pattern.
The second scenario is more likely to form.
Disclaimer
The information and publications are not meant to be, and do not constitute, financial, investment, trading, or other types of advice or recommendations supplied or endorsed by TradingView. Read more in the Terms of Use.
Disclaimer
The information and publications are not meant to be, and do not constitute, financial, investment, trading, or other types of advice or recommendations supplied or endorsed by TradingView. Read more in the Terms of Use.