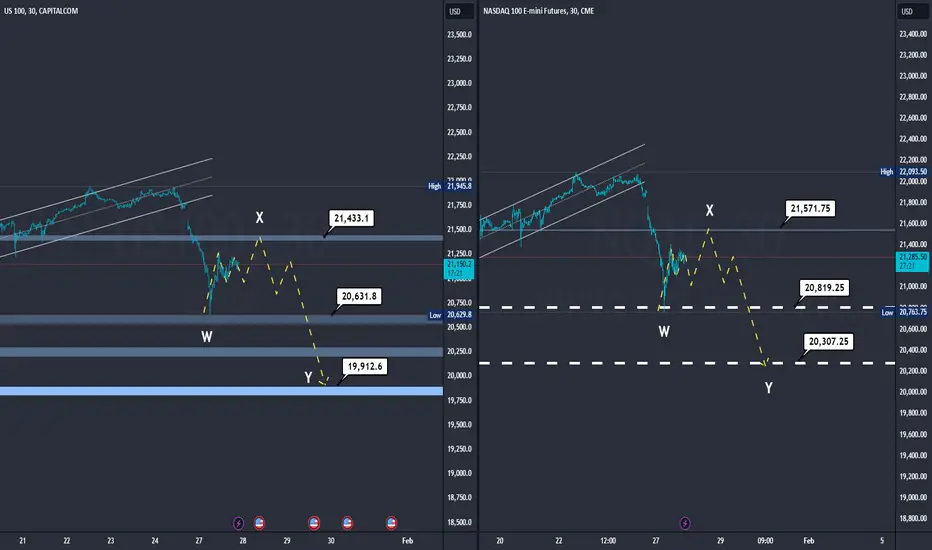
NASDAQ (Left)
Elliott Wave Pattern: A possible Elliott Wave pattern is seen with an impulse and correction structure. Wave X appears to be a resistance point where the price has bounced down.
Key Zones:
Resistance: 21,433.1 (point X)
Support: 20,150.6 (point W)
Zone of Interest: 19,912.6 (point Y)
Analysis: The price has touched the resistance at 21,433.1 and has pulled back. If the price breaks this level, it could signal a continuation of the bullish movement. However, if the price fails to overcome this resistance and falls again, it could look for support at 20,150.6 or even lower at 19,912.6.
NQ (Right)
Elliott Wave Pattern: Similar to the NASDAQ, a wave pattern is observed with an impulse and correction structure. Point X again acts as resistance.
Key Zones:
Resistance: 21,571.75 (point X)
Support: 20,819.25 (point W)
Zone of Interest: 20,307.25 (point Y)
Analysis: The price has touched the resistance at 21,571.75 and has turned down. If the price breaks this resistance, it could indicate a strong bullish movement. If not, the price could look for the support at 20,819.25 or continue to move down towards 20,307.25.
Trading Idea on TradingView
Trading Strategy:
NASDAQ:
Long Entry: If price breaks and closes above 21,433.1 with significant volume, it could be a signal to go long, looking for an initial target at the next resistance.
Short Entry: If price fails to break 21,433.1 and shows signs of reversal, a short entry could be considered with a target towards 20,150.6 or 19,912.6.
NQ:
Long Entry: A close above 21,571.75 with volume confirmation would be a signal for a long position, targeting the next resistance.
Short Entry: If price fails to break 21,571.75 and starts to decline, a short entry could be viable with targets at 20,819.25 or 20,307.25.
Risk Management:
Stop Loss: For long entries, place a stop loss below the last significant support. For short entries, above the last resistance.
Take Profit: Adjust according to the identified support and resistance levels.
Disclaimer
The information and publications are not meant to be, and do not constitute, financial, investment, trading, or other types of advice or recommendations supplied or endorsed by TradingView. Read more in the Terms of Use.
Disclaimer
The information and publications are not meant to be, and do not constitute, financial, investment, trading, or other types of advice or recommendations supplied or endorsed by TradingView. Read more in the Terms of Use.