Edit: OOPS! I pulled the chart too far back when publishing. I would suggest looking at the chat with the high and the low of the day as well as including the asian session from yesterday.
like this

*Smart Money Concepts is the technical analysis that takes the opposite appproach of retail ttechnical analysis. Don't think as if you were taught the first time to trade. Think as if you're a market maker and can manipulate the market.
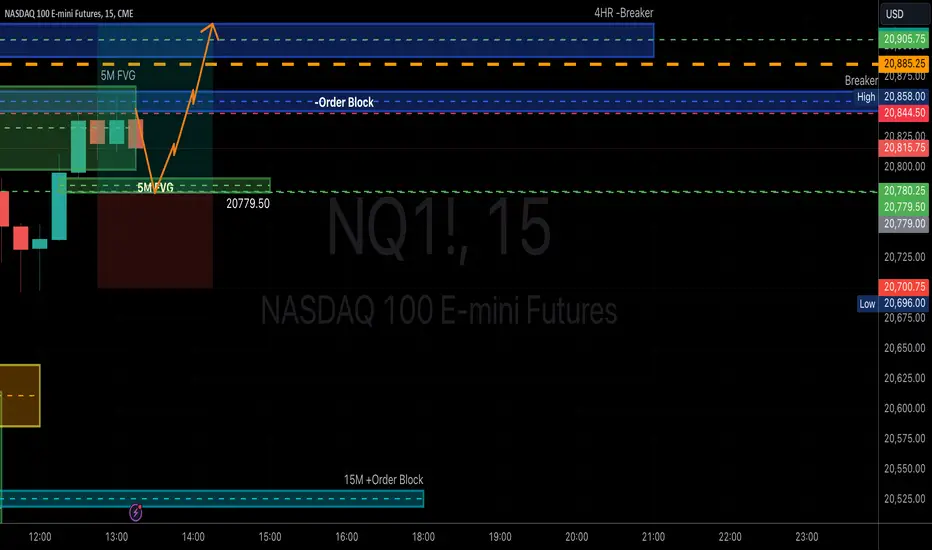
In th 5 min chart of Nasdaq Futures. There's a small unbalanced candle that breaks the most recent high (Not a major high just a session mid-high). The bottom of that FVG is also the top of that short high that triggers liquidity at $20780.25 See Chart

If price reaches int that FVG, I will jump in with a PM session silver Bulllet opportunity. Keep in mind. that you have two bearish breakers/order blocks on your way up. However, considering we haven't been breaking lows, I have a feeling the afternoon session will be going for breaking Liquidity in a high, above 20,905. and NAS100USD possibly to the Top of the 1 HR Breaker. see chart.

If it doesn't fall back into this area. I'll just sit n my hands and not risk chasing something I do not see that a institution would would do.
Entry is 20791.00, Full Take Profit 20918.00 (Possibly banking two take profits along the way as it hits bearish breakers and moving the stop loss to even.) Srop loss will depend on time. If before 2pm NY Time then 20700.75. Be careful after 2 p.m. as price will have a tendency to move a lot faster and your stop loss could get hit in a matter of minutes. So I would shallow it to 20,780, and look for another entry
Good luck and happy trading.
NQ1!
NAS100USD
NAS100
like this
*Smart Money Concepts is the technical analysis that takes the opposite appproach of retail ttechnical analysis. Don't think as if you were taught the first time to trade. Think as if you're a market maker and can manipulate the market.
In th 5 min chart of Nasdaq Futures. There's a small unbalanced candle that breaks the most recent high (Not a major high just a session mid-high). The bottom of that FVG is also the top of that short high that triggers liquidity at $20780.25 See Chart
If price reaches int that FVG, I will jump in with a PM session silver Bulllet opportunity. Keep in mind. that you have two bearish breakers/order blocks on your way up. However, considering we haven't been breaking lows, I have a feeling the afternoon session will be going for breaking Liquidity in a high, above 20,905. and
If it doesn't fall back into this area. I'll just sit n my hands and not risk chasing something I do not see that a institution would would do.
Entry is 20791.00, Full Take Profit 20918.00 (Possibly banking two take profits along the way as it hits bearish breakers and moving the stop loss to even.) Srop loss will depend on time. If before 2pm NY Time then 20700.75. Be careful after 2 p.m. as price will have a tendency to move a lot faster and your stop loss could get hit in a matter of minutes. So I would shallow it to 20,780, and look for another entry
Good luck and happy trading.
Trade active
The trade is not active. It doesn't give me the option to just comment on the chart. But it has now filled the 5 min FVG, It should move the opposite direction (down) to fill it going both directions. Its the downward action I'll be paying close attention to. Trade closed manually
Ok here's the chart of where I took my entry and the 4 times I took profit. You have to go to the bottom of the comments and read upward to get the time line. But the first take profit was a Bearish Breaker (Bottom of a 5 minute candle) at $20,845, 30% profit taken. Then take profit 2 was the next 5 mnute bearish breaker, (bottom of the 5 min candle) $20,853 Not much higher which is why I only took 15% of the profit there. Then It broke a local high $20,870, 20% profit there. I thought it was going higher or I would've taken all of it there. The key to beng a good trader is not that you hit home runs, but instead take little by little. After it broke the high I was on my way to work, literally watching the chart as I'm driving. It was about 3:48 pm, 12 minutes left, and it started to look like the price was heading toward my original Entry ($20,790) So I decided to close it out with 12 minutes left because I. didn't think I was going to be taking much more. So I closed out the last 35% at the first take profit price of $20,845. so thats 200 ticks, 232 ticks, 300 ticks, and another 200 ticks, total of 932 ticks.Again, it didn't hit my Full take profit I wanted. But I didn't hold the entire time and lose most of the trade. Stargize your. take profits so you can win every trade even if you lose. See the hart of my take profits, when they happened and the price range for each take profit. Hope Everyone had good trades as well!You're either trading with Smart Money Theory or your just burning your money money. Believe me, I've been there.
Disclaimer
The information and publications are not meant to be, and do not constitute, financial, investment, trading, or other types of advice or recommendations supplied or endorsed by TradingView. Read more in the Terms of Use.
You're either trading with Smart Money Theory or your just burning your money money. Believe me, I've been there.
Disclaimer
The information and publications are not meant to be, and do not constitute, financial, investment, trading, or other types of advice or recommendations supplied or endorsed by TradingView. Read more in the Terms of Use.