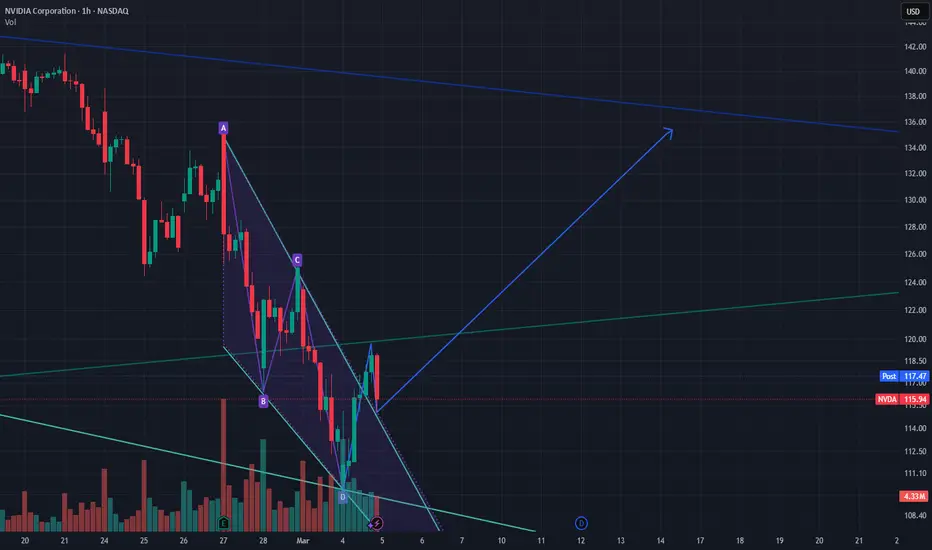
Another falling wedge pattern has formed on NVDA's hourly chart, with price action contained between two converging downward trendlines. The stock shows a potential bullish reversal setup after testing major support at 109. Volume has been declining during the pattern formation, which is why a falling wedge. Pull back to retest upper trendline.
SL at 108 1st target 131
SL at 108 1st target 131
Related publications
Disclaimer
The information and publications are not meant to be, and do not constitute, financial, investment, trading, or other types of advice or recommendations supplied or endorsed by TradingView. Read more in the Terms of Use.
Related publications
Disclaimer
The information and publications are not meant to be, and do not constitute, financial, investment, trading, or other types of advice or recommendations supplied or endorsed by TradingView. Read more in the Terms of Use.