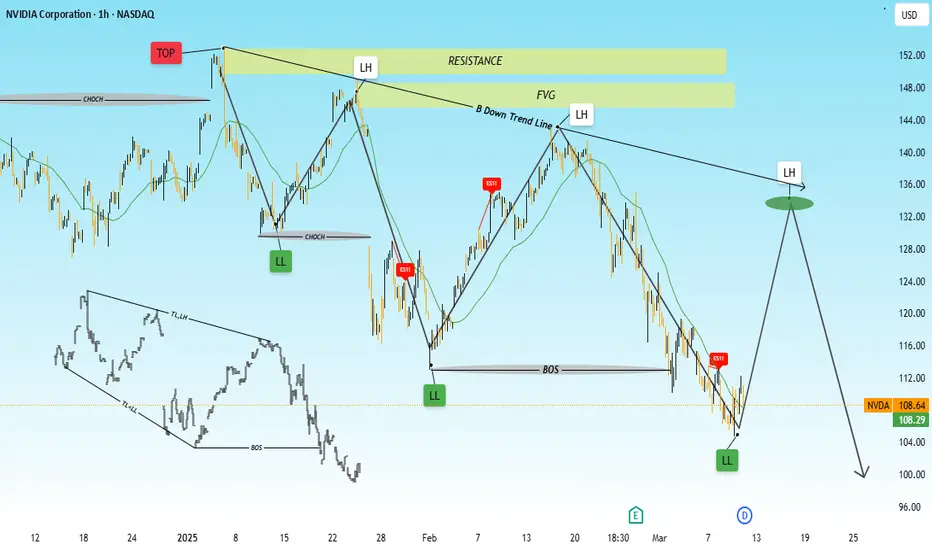
This chart appears to be a technical analysis of NVIDIA Corporation (NVDA) on the 1-hour timeframe. The tools and patterns applied include:
1. *Market Structure Concepts*:
- *Lower Highs (LH) and Lower Lows (LL)*: These indicate a downtrend.
- *Break of Structure (BOS)*: Suggests a shift in market direction.
- *Change of Character (CHOCH)*: A potential trend reversal signal.
2. *Support & Resistance*:
- *Resistance Zone*: Marked at the top where price previously reversed.
- *Fair Value Gap (FVG)*: Indicates an imbalance in price action, often leading to a reaction.
3. *Trendlines*:
- *Downtrend Line*: Connects lower highs to show the prevailing bearish trend.
4. *Indicators*:
- *Moving Averages*: Likely used to smooth price action and identify trend direction.
5. *Wyckoff/Fractal Structure*:
- The boxed schematic at the bottom left suggests a fractal or Wyckoff accumulation/distribution phase.
6. *Price Action Projection*:
- The projected path suggests a potential retracement to a lower high before another decline.
Would you like further insights on how to trade based on this analysis?
t.me/Xauusdanalysischartexperts
I deliver high-quality of forex signals and expert premium analysis updates, backed by meticulous analysis tools. and a commitment to exceptional results.
t.me/Xauusdanalysischartexperts
I deliver high-quality of forex signals and expert premium analysis updates, backed by meticulous analysis tools. and a commitment to exceptional results.
t.me/Xauusdanalysischartexperts
Disclaimer
The information and publications are not meant to be, and do not constitute, financial, investment, trading, or other types of advice or recommendations supplied or endorsed by TradingView. Read more in the Terms of Use.
t.me/Xauusdanalysischartexperts
I deliver high-quality of forex signals and expert premium analysis updates, backed by meticulous analysis tools. and a commitment to exceptional results.
t.me/Xauusdanalysischartexperts
I deliver high-quality of forex signals and expert premium analysis updates, backed by meticulous analysis tools. and a commitment to exceptional results.
t.me/Xauusdanalysischartexperts
Disclaimer
The information and publications are not meant to be, and do not constitute, financial, investment, trading, or other types of advice or recommendations supplied or endorsed by TradingView. Read more in the Terms of Use.
