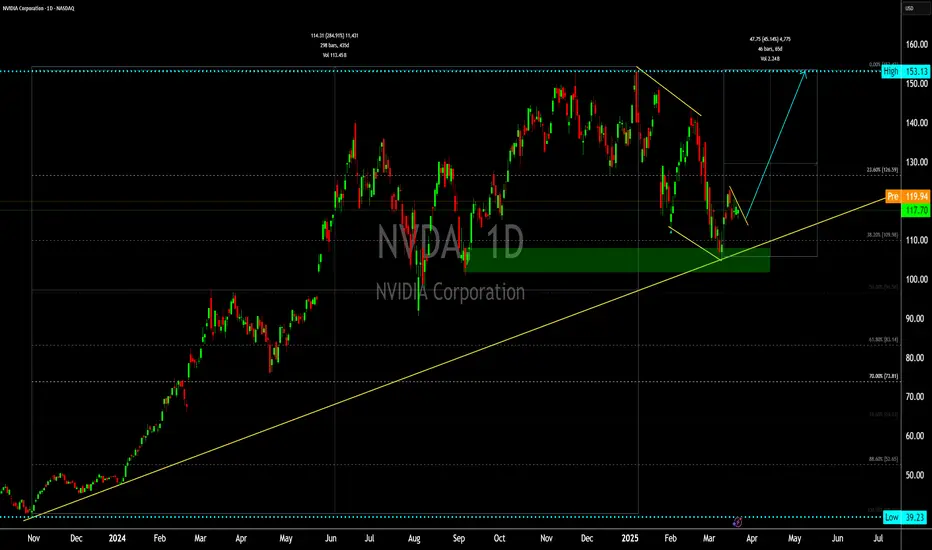
This chart presents a bullish setup for NVIDIA Corporation (NVDA) on the 1D (daily) timeframe. The setup is based on multiple technical analysis tools, which indicate a potential upward movement. Let's break it down:
1. Trendlines & Support Zone
Ascending Trendline (Yellow): A long-term uptrend support line connects previous price lows, indicating an overall bullish trend.
Green Support Zone: The price recently touched this demand area, showing that buyers are stepping in to push the price higher.
This trendline support + demand zone combination strengthens the case for a reversal.
2. Falling Wedge Pattern (Bullish Reversal)
The price formed a falling wedge (marked by two converging yellow trendlines).
A falling wedge is a classic bullish reversal pattern, meaning that once the price breaks above the wedge, an upward rally is expected.
The price broke out of the wedge and started moving higher, confirming a potential reversal.
3. Fibonacci Retracement Levels
The chart shows a Fibonacci retracement overlay, with key levels:
38.2% level (~$109.98): This acted as support.
23.6% level (~$126.59): A potential first target.
The price is currently rebounding from the 38.2% retracement, a strong area where buyers often enter.
4. Projected Price Target (Bullish Move)
Blue Arrow Projection: The blue line indicates the expected price path.
Target: $153.13 (High) – The price could aim for previous highs after confirmation of the breakout.
5. Volume Confirmation
A volume increase at the breakout suggests strong buying interest, further confirming the bullish bias.
Conclusion: Why This Is a Buy Setup?
✅ Strong Trendline Support → Buyers defending this area.
✅ Falling Wedge Breakout → Bullish reversal pattern confirmed.
✅ Fibonacci 38.2% Support → Key retracement level holding.
✅ Target Projection to $153.13 → High probability move.
This setup suggests that NVIDIA could continue moving upwards in the coming weeks if it maintains above support levels.
For Training visit.
Website wave-trader.com
Website techtradingacademy.com
Slack: wavetraders.slack.com
Telegram: t.me/Wavetraders
X: twitter.com/Wave__Trader
FB: facebook.com/WTimran
Website wave-trader.com
Website techtradingacademy.com
Slack: wavetraders.slack.com
Telegram: t.me/Wavetraders
X: twitter.com/Wave__Trader
FB: facebook.com/WTimran
Related publications
Disclaimer
The information and publications are not meant to be, and do not constitute, financial, investment, trading, or other types of advice or recommendations supplied or endorsed by TradingView. Read more in the Terms of Use.