Looking at NVIDIA's technical setup, I've identified a critical support zone that could launch
Technical Analysis
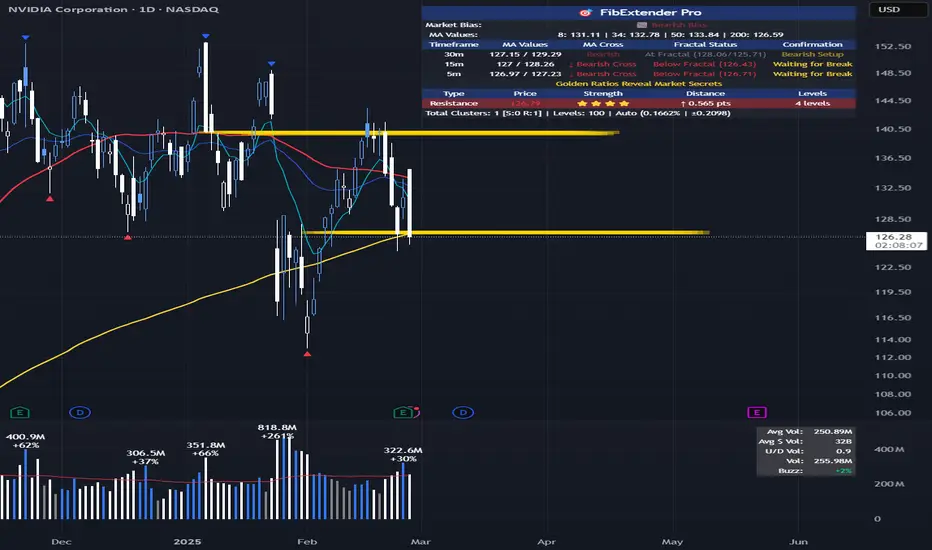
The current price action shows NVIDIA testing a key support zone consisting of:
- Fibonacci cluster at 126.5
- 200 Moving Average support
If this support zone holds, I'm targeting the next Fibonacci cluster at 140, representing approximately a 10.7% upside potential.
Entry Strategy
I'm monitoring two potential entry scenarios:
Aggressive Entry (15-minute chart):
- Wait for 8 EMA to cross above 34 EMA
- Price must break above the most recent swing high
- Entry on confirmation of this break
Conservative Entry (30-minute chart):
- Same criteria as above but on the 30-minute timeframe
- Provides more reliable signals with fewer false breakouts
Risk Management
Stop Loss: Place stops below the 126.5 Fibonacci/200 MA support zone (approximately 124-125)
Profit Target: First target at the 140 Fibonacci cluster
Conflicting Indicators
My analysis shows mixed signals that require caution:
1. My WillVall indicator on the weekly chart shows a potential buy opportunity at current prices, BUT it needs to change direction and move above the 15 level before confirming a long-term entry
2. Multiple timeframe squeeze indicators (Weekly, 4D, 3D, 2D) are currently in squeeze with negative momentum, suggesting downside pressure
3. According to IBD Market School methodology, the market is showing signs of correction and the buy switch is currently OFF, indicating we should avoid new long positions
Trade Plan
Given the current market conditions and mixed signals:
- Wait for confirmation of support at the 126.5 zone
- Look for entry signal confirmation on preferred timeframe
- Use smaller position size due to conflicting indicators
- Set clear stop loss below support (124-125)
- Target the 140 Fibonacci cluster for profit taking
I'll remain patient and wait for clearer market conditions before committing significant capital to this trade. The technical setup is promising, but broader market conditions suggest caution.
Trade active
After monitoring the NVIDIA setup I shared previously, I need to provide an important update as market conditions have changed.
Setup Invalidation
The critical support zone I identified at the 126.5 Fibonacci cluster and 200 MA has failed to hold. This invalidates my previous bullish scenario targeting 140, and we need to adjust our outlook accordingly.
New Support Target
With the breakdown below our key support level, the next significant support zone appears at the 120 level.
Potential Reversal Zone
Should
Market Context
This breakdown aligns with the broader market caution I mentioned in my previous analysis. The IBD Market School indicators showing correction signals and the "buy switch OFF" status have proven accurate, reinforcing the importance of waiting for proper market conditions before entering new positions.
I'll continue monitoring NVDA's price action around these key levels and provide further updates as the technical picture evolves.
Order cancelled
The TradeVizion™
For our premium indicators! whop.com/tradevizion/
For our premium indicators! whop.com/tradevizion/
Disclaimer
The information and publications are not meant to be, and do not constitute, financial, investment, trading, or other types of advice or recommendations supplied or endorsed by TradingView. Read more in the Terms of Use.
TradeVizion™
For our premium indicators! whop.com/tradevizion/
For our premium indicators! whop.com/tradevizion/
Disclaimer
The information and publications are not meant to be, and do not constitute, financial, investment, trading, or other types of advice or recommendations supplied or endorsed by TradingView. Read more in the Terms of Use.