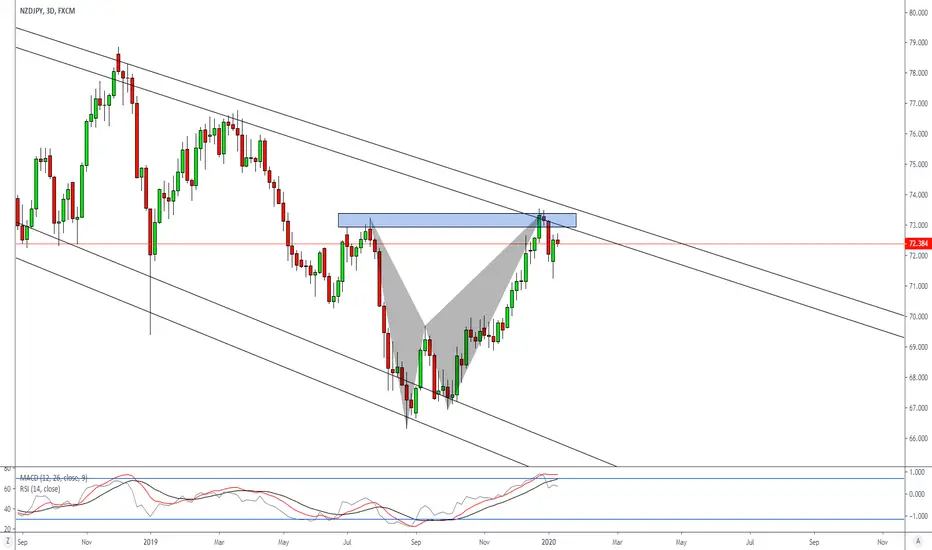
NZDJPY is at the upper trendline in a bearish channel. On the chart we can see a lot of indications that the price might begin to go down again (does not necessarily mean there is a higher chance of it to happen)
The price has formed a bearish bat pattern, RSI has been overbought, MACD about to turn bearish, it is at a previous resistance level and it is also at the upper trendline
Look on lower timeframes for entry
SL above the high
Let's see how it goes
The price has formed a bearish bat pattern, RSI has been overbought, MACD about to turn bearish, it is at a previous resistance level and it is also at the upper trendline
Look on lower timeframes for entry
SL above the high
Let's see how it goes
Disclaimer
The information and publications are not meant to be, and do not constitute, financial, investment, trading, or other types of advice or recommendations supplied or endorsed by TradingView. Read more in the Terms of Use.
Disclaimer
The information and publications are not meant to be, and do not constitute, financial, investment, trading, or other types of advice or recommendations supplied or endorsed by TradingView. Read more in the Terms of Use.