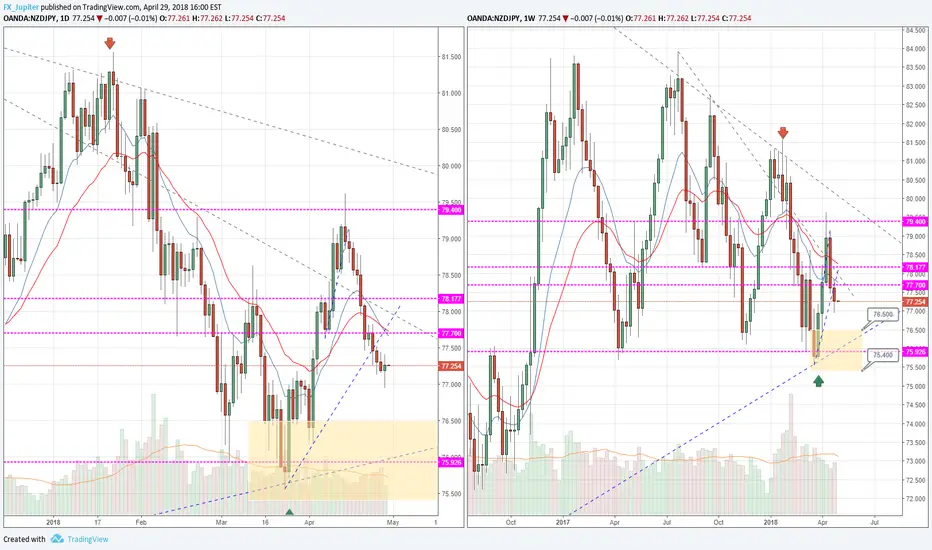
Weekly Chart:
Bearish candle
Daily Chart:
Daily chart broke the short term up-trend line since 22 Mar 2018 will act as a first resistance
Watch out:
There might be a pullback to retest the short term trend line
Weekly demand zone: 75.4-76.5
Action:
Wait to join the Bears
Bearish candle
Daily Chart:
Daily chart broke the short term up-trend line since 22 Mar 2018 will act as a first resistance
Watch out:
There might be a pullback to retest the short term trend line
Weekly demand zone: 75.4-76.5
Action:
Wait to join the Bears
Trade closed manually
Closed with nice profit.Related publications
Disclaimer
The information and publications are not meant to be, and do not constitute, financial, investment, trading, or other types of advice or recommendations supplied or endorsed by TradingView. Read more in the Terms of Use.
Related publications
Disclaimer
The information and publications are not meant to be, and do not constitute, financial, investment, trading, or other types of advice or recommendations supplied or endorsed by TradingView. Read more in the Terms of Use.