
Analysis Overview:
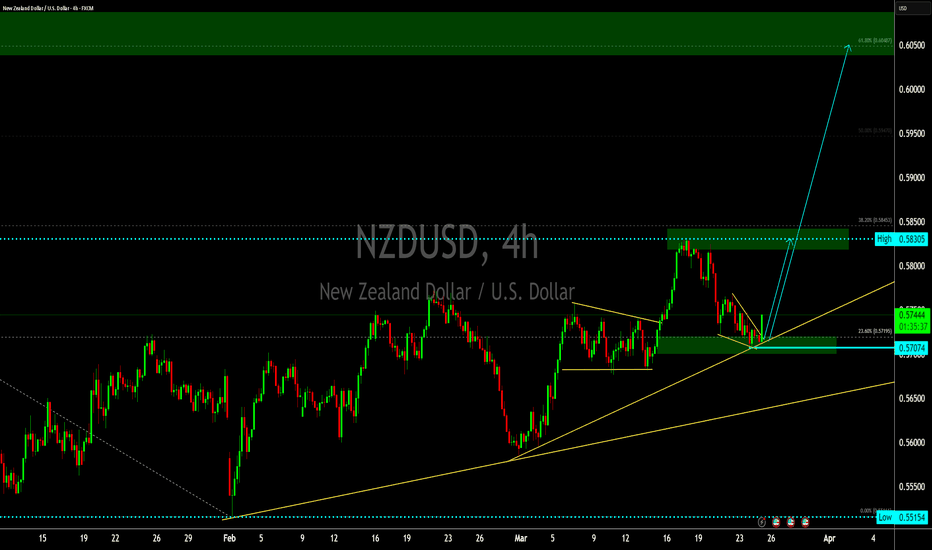
This daily chart of NZD/USD highlights a potential bullish breakout setup based on price action, trendlines, and Fibonacci retracement levels.
Key Technical Elements:
Descending Trendline Breakout:
The price is forming a contracting pattern with a descending trendline.
A breakout above this trendline could signal bullish momentum.
Ascending Support Trendline:
A yellow upward-sloping trendline indicates rising support, suggesting accumulation.
Buyers are stepping in at higher levels.
Fibonacci Retracement Levels:
The chart displays key Fibonacci retracement levels based on the previous downtrend.
The 61.8% Fibonacci retracement level at 0.6048 aligns with a strong resistance zone (marked in green).
Breakout Confirmation:
A label on the chart suggests "Watch for Breakout", indicating a potential bullish move.
If the price successfully breaks above the trendline and the 23.6% Fibonacci level (0.5719), a rally toward the 61.8% zone (0.6048) is likely.
Target Levels:
First target: 0.6048 (61.8% Fibonacci)
Final target: 0.6378 (previous high)
Trading Plan:
Entry: On breakout above the trendline, with confirmation from volume or a strong bullish candle.
Stop-loss: Below recent swing low (~0.5600 area).
Take-profit levels: 0.6048 (main resistance), with an extended target at 0.6378.
Conclusion:
This setup suggests a potential bullish reversal if the breakout is confirmed. Traders should wait for confirmation before entering, ensuring the price does not get rejected at resistance levels.
Note
For Training visit.
Website wave-trader.com
Website techtradingacademy.com
Slack: wavetraders.slack.com
Telegram: t.me/Wavetraders
X: twitter.com/Wave__Trader
FB: facebook.com/WTimran
Website wave-trader.com
Website techtradingacademy.com
Slack: wavetraders.slack.com
Telegram: t.me/Wavetraders
X: twitter.com/Wave__Trader
FB: facebook.com/WTimran
Disclaimer
The information and publications are not meant to be, and do not constitute, financial, investment, trading, or other types of advice or recommendations supplied or endorsed by TradingView. Read more in the Terms of Use.