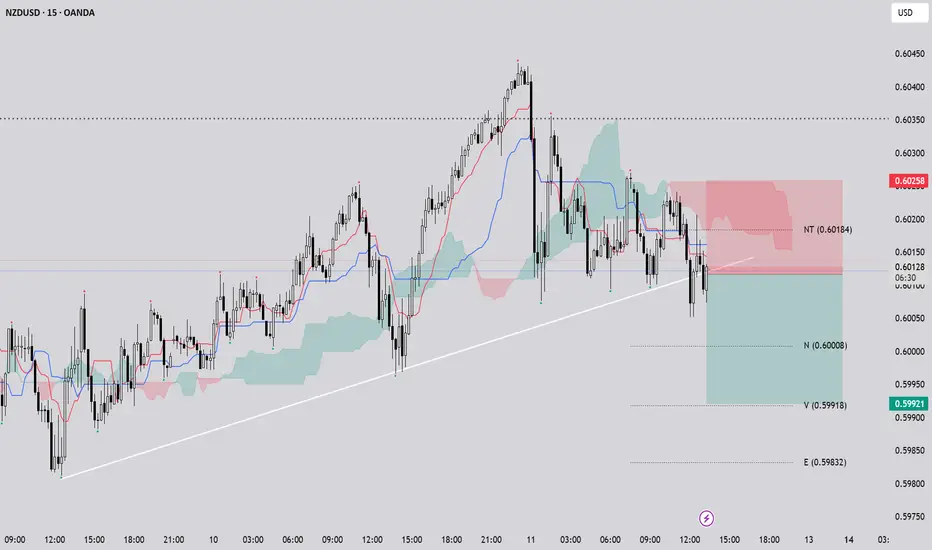
On the 15-minute chart of NZDUSD, a shift in market structure is evident as the prior uptrend—previously supported by ascending trendlines—has been broken. The Ichimoku cloud (Kumo) outlines key support and resistance zones, and price movement outside the cloud reinforces the weakening of the bullish momentum. The crossover between the Tenkan-sen and Kijun-sen lines aligns with the wave structure, signaling a potential bearish phase. This combination of technical signals suggests that the market may be transitioning into a corrective move or a short-term downtrend, presenting a potential opportunity for short positions.
Trade active
1st target "N" touched ...If you liked this analysis, hit the BOOST !Trade closed: target reached
Traget Reached If you liked this analysis, hit the BOOST !
Disclaimer
The information and publications are not meant to be, and do not constitute, financial, investment, trading, or other types of advice or recommendations supplied or endorsed by TradingView. Read more in the Terms of Use.
Disclaimer
The information and publications are not meant to be, and do not constitute, financial, investment, trading, or other types of advice or recommendations supplied or endorsed by TradingView. Read more in the Terms of Use.